Cardano short-term Price Analysis; 10th June

Over the past couple of months, Cardano has witnessed increasing popularity as Shelley mainnet release nears. At press time, the coin was traded at $0.0815.
ADA 4-Hour Chart:

Source: ADA/USD on TradingView
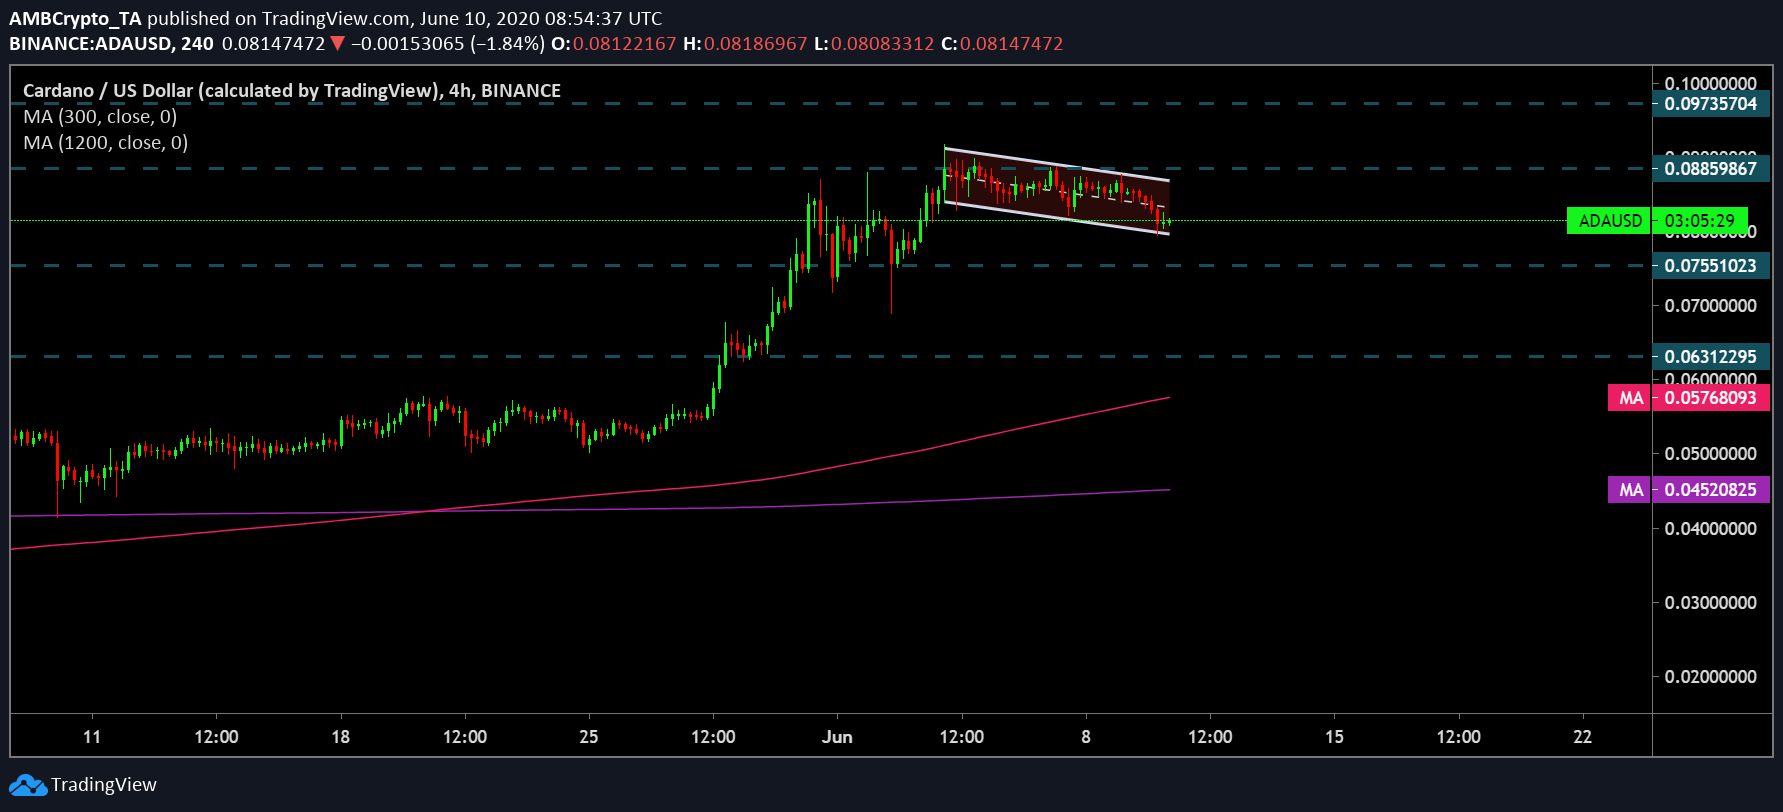
A descending channel pattern could be seen on Cardano’s short-term chart. This could lead to a potential upward breakout. The placement of daily moving averages also pointed toward a bullish phase. Following a golden cross in the third week of May, 50 DMA [Pink] continued treading above 200 DMA [Purple]. This resulted in an increasing divergence between the two, which was indicative of continuation of a bullish trend.
In addition, the two moving averages were also hovering below ADA price candles and formed critical supports for the coin.

Source: ADA/USD on TradingView
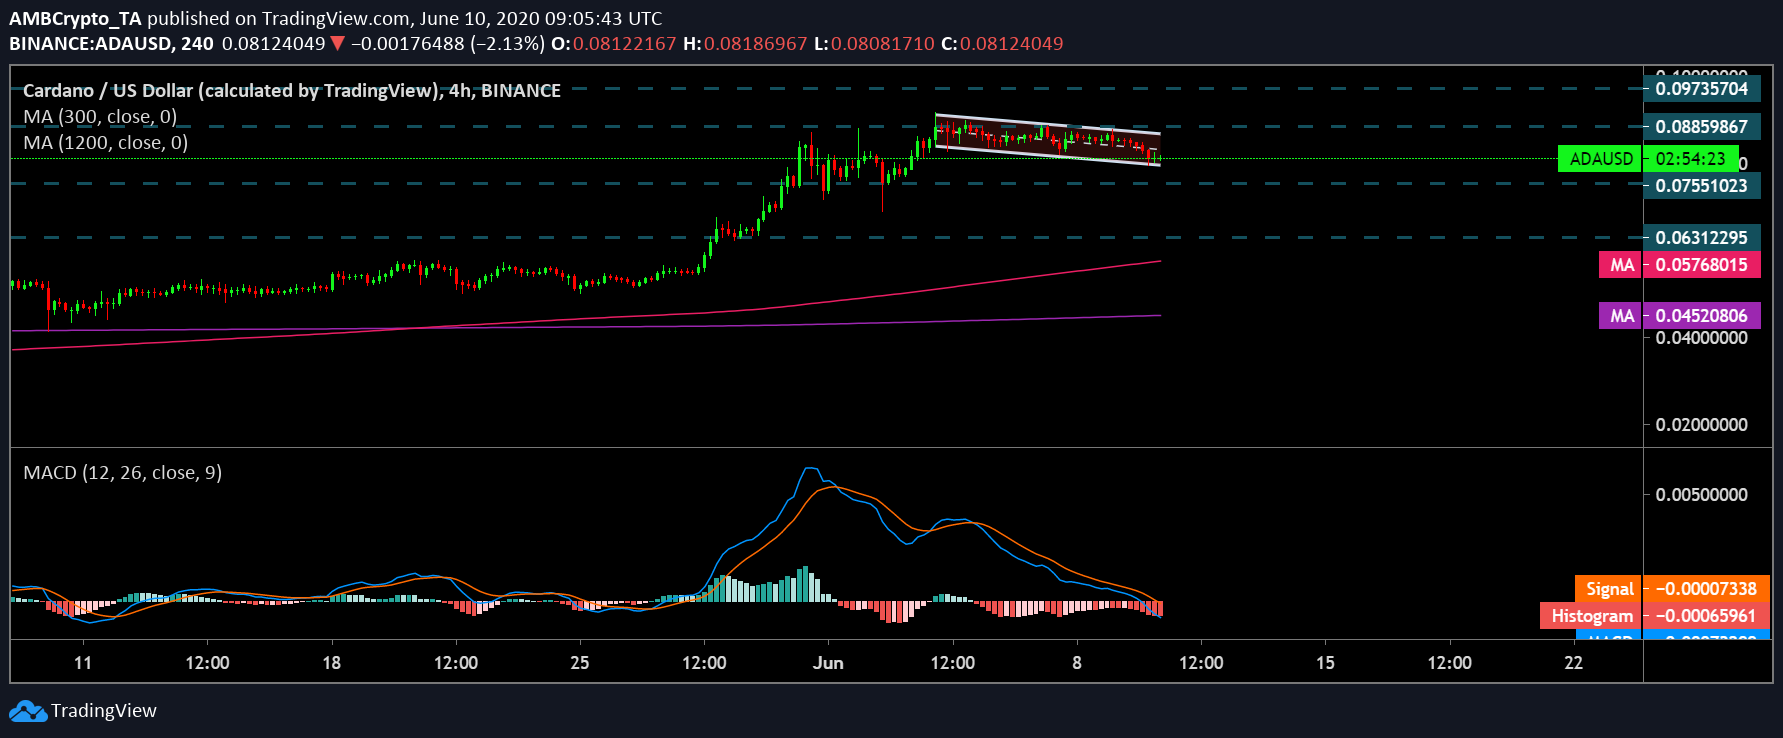
MACD indicator, however, aligned with the bears. This could potentially imply that the coin could undergo another bounce before climbing closer to the upper downsloping trendline before finally breaching it.
If a bullish case materializes, ADA could climb all the way to $0.088 in the short-term. If this trend gains momentum, the coin could target another resistance level at $0.097. The coin’s price was found to be significantly supported at $0.075 and $0.0632.
Correlation:

Source: Coin Metrics
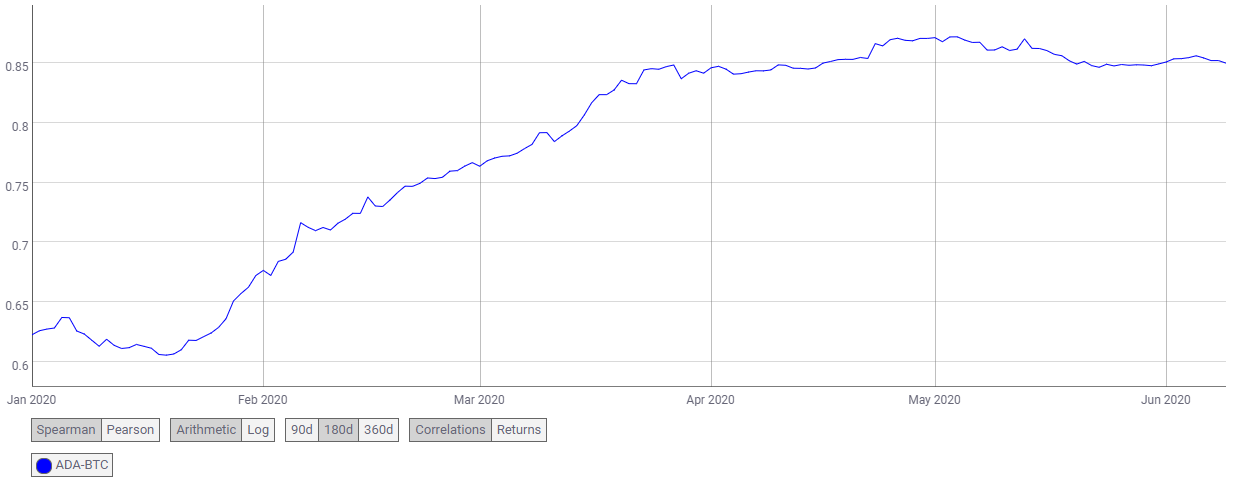
Despite minor decoupling, ADA ‘s correlation to Bitcoin’s price steadily increased since the beginning of the year. At the time of writing, correlation coefficient for ADA-BTC was 0.85. This potentially implied that Bitcoin’s upward swing would be a huge catalyst for the price of ADA.
Conclusion:
A potential bullish breakout around 10th June was indicated by the above charts. Target points stand at $0.088 and $0.097.


