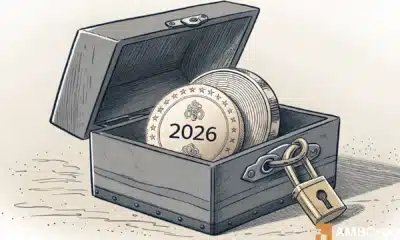
Have you been missing the price action in Bitcoin markets across exchanges lately? Based on WooBull’s Bitcoin volatility chart, 60-day volatility is 5.65 and 90-day volatility is 8.95. The recent drop in volatility can be attributed to the reduced inflow of Bitcoin into exchanges.
Bitcoin Volatility || Source: Woobull Charts
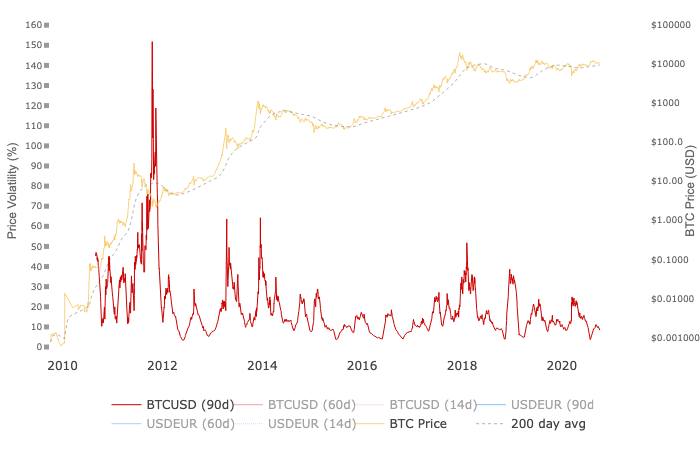
Trade volume on spot exchanges like Binance has shown signs of speedy recovery with 10% and 25%. The 24-hour increase in volume on Binance is 12.39%, while on Kraken it rose by 25%. On both these exchanges, Bitcoin trade volume increased as HODLers are realizing unbooked profits/ losses and brining more Bitcoin to exchange wallets.
Top Spot Exchanges || Source: Coinmarketcap
Inflow to Binance increased from mining pools and HODLers achieving a peak similar to July 2020 level. Sustained inflow may increase the volume to April 2020 level. This increase in inflow was noticed by on-chain analysts and crypto influencers on Twitter.

BTC Inflow on Binance || Source: Cryptoquant
ColeGarner commented on the new bull market based on a spike in the number of wallets chart. Back in 2017 before the historic bull run when Google searches for Bitcoin hit an ATH, there was a peak in the number of Bitcoin wallets.

Source: Twitter
Cole suggests that active address counts are an indicator of volume, however, this may be an indicator of increasing interest in Bitcoin. On exchanges like CME, open interest increases more than trade volume frequently. Open interest increases due to both bullish and bearish predictions, and this parallel can be drawn to wallets as well. Another reason why an increase in wallets is not directly proportional to Bitcoin trade volume is unspent Bitcoin being accumulated at the current price level.
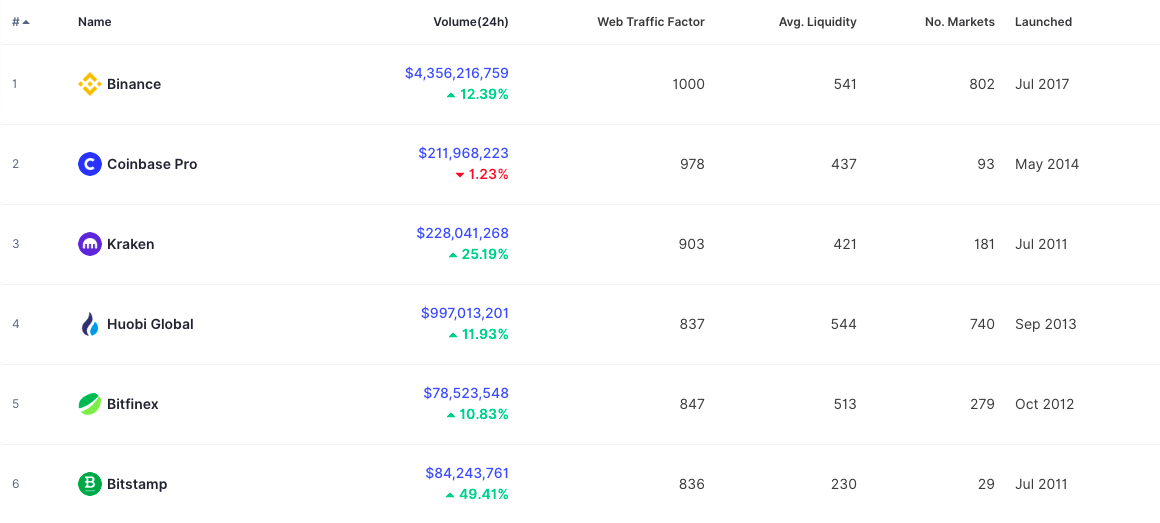
In the past week, most Bitcoin has been accumulated in the $10-11k range. This accumulation does not warrant selling in the same range and there is a high likelihood that further accumulation occurs.
Map of unspent Bitcoins || Source: Whalemap
Based on this chart from Whalemap, accumulation occurred in the same range in September 2020. Despite this, the high activity being recorded on charts, like ColeGarner suggested is not visible on other on-chain metrics. Though Cole suggests that the increase in activity hints towards the start of a new bull market, there is a likelihood that this may just be noise in the long run.