Crypto News
Bitcoin’s volatile days are taking a break till the halving?

April 12, is a pivotal day for the Bitcoin market. If you look closely at the calendar, it marks one month since the biggest price plummet of the cryptocurrency in the past seven years, and marks one month to the very reason for the price plummet.
On March 12, Bitcoin lost over 50 percent of its value in less than 24-hours as two simultaneous push and pull effects ravaged the markets. The million-dollar question of ‘Is the halving priced-in?’ divided the market, as the pandemic-induced economic crisis began a strike of liquidity, causing a drop in the highly liquid Bitcoin market, in addition to its equivalent commodity and equity markets.
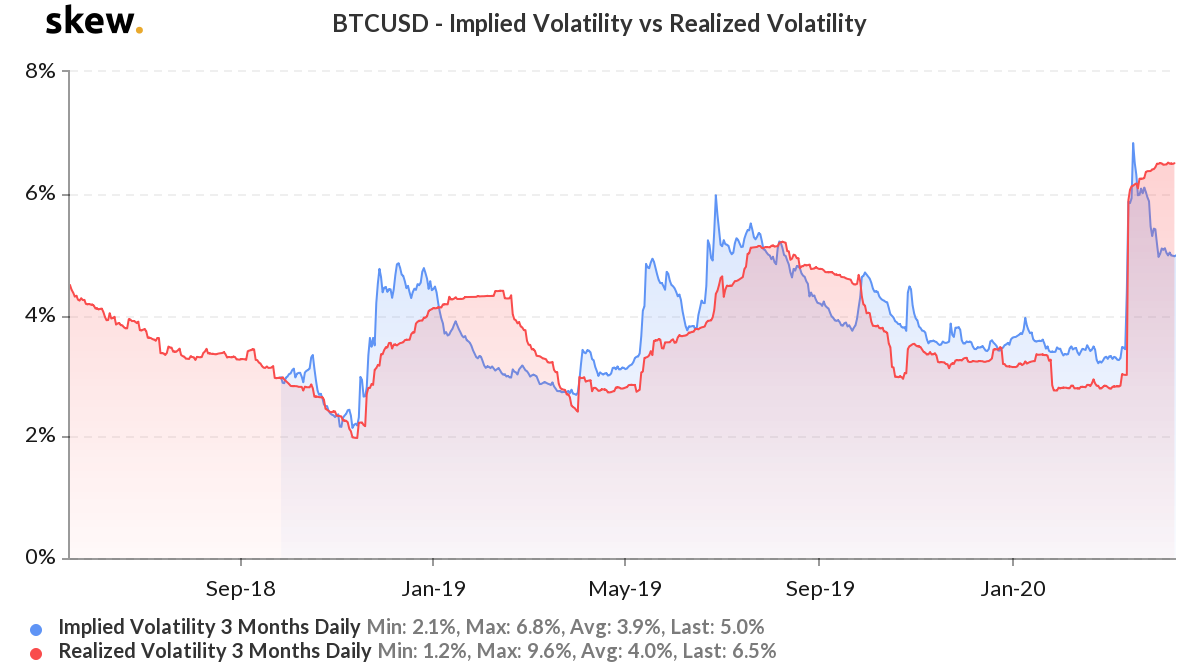
Looking more closely at the Bitcoin markets, and its volatility in the past month coupled with volatility leading up to the halving in exactly 30 days’ time, the journey looks to be more stable than before. According to data from skew markets, there is now a huge difference between the realized or historic 3-month volatility of Bitcoin, and its implied or expected 3-month volatility.

Bitcoin realized volatility vs implied volatility | Source: skew
In fact, since skew began recording this data in October 2019, the press time difference between the two volatility indexes is the maximum it has been. Realized volatility stands at 6.5 percent, while its forward-looking equivalent is at 5 percent. While realized volatility is calculated based on historic price movements, the expected volatility is assessed based on the strike price of Bitcoin options contracts, within the aforementioned expiry periods.
The difference between the two volatility metrics began to widen from March 19, when the post-plummet price began to resurge slowly but steadily. However, at the beginning of the previous week, a surge over $7,000 was undone, with the press time price of Bitcoin at $6,800.
Bitcoin ATM Volatility Term Structure | Source: skew
As things stand, the cryptocurrency is still 12 percent off where it was prior to the plummet and over 30 percent below where it was exactly two months ago in February. Given the decreasing month-on-month volatility, traders are expecting the next 30 days to be relatively quiet.
This sentiment is attested by the BTC ATM volatility term structure which suggests a dip in price fluctuation till the end of April. From then on, it would be a return to the old days. The volatility term structure, based on options’ strike prices, suggest that volatility is set to skyrocket from late May to December 2020

