Analysis
Bitcoin’s spiraling price may bounce back with descending channel breach
Bitcoin’s price slumped on 7 November by 1.95%, a drop that pulled the price of the largest coin down to $9,129.48. However, it soon sprung by 0.73% and was trading at $9,185.01 with a market cap of $166.20 billion, at press time. The short-term chart for Bitcoin suggested an imminent spike in the price of the largest cryptocurrency as a bullish pattern was pictured.
1-hour

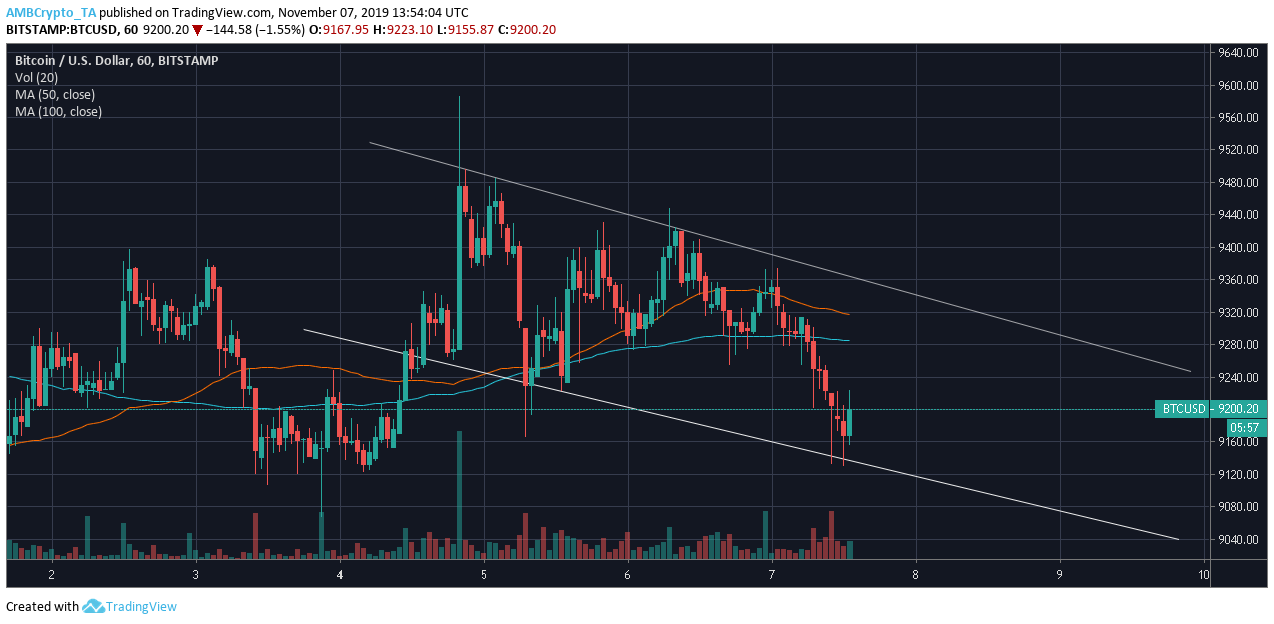
Source: BTC/USD on Trading View
The hourly chart for Bitcoin recorded a descending channel. The price of the coin was depreciating within the channel and the lower highs were marked at $9,494.63, $9,485, and $9,423.8, while the lower lows were at $9,230.14, $9,222, and $9,137.04. The breakout predicted to occur within a few days might see a breakout towards the bullish end.
The 50 moving average and 100 moving average aligned above the candlesticks, noting a bearish pressure in the market. However, the 50 average was above the 100 average, indicating a bullish market.

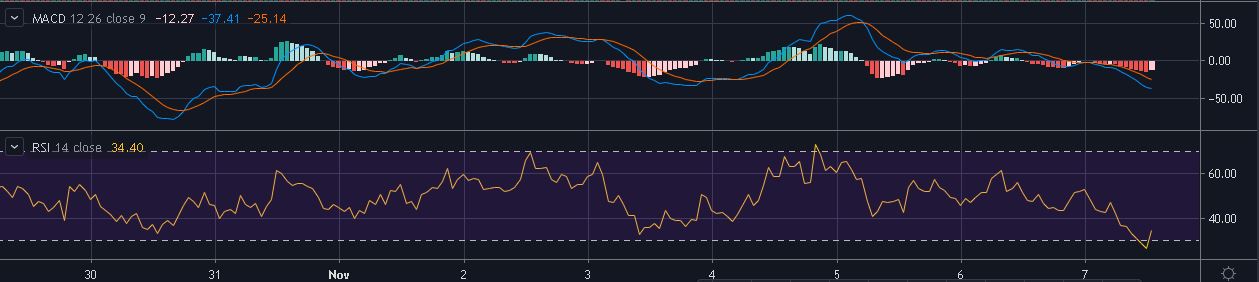
Source: BTC/USD on Trading View
The MACD indicator implied high bearish momentum in the market as the MACD line was under the signal line. On the contrary, the Relative Strength Index just bounced from the oversold zone and was still lingering close to it, indicating a bearish market.
Conclusion
Bitcoin’s market saw a gradual fall in the king coin’s price, despite the large gains made at the end of October. However, the bearish trend might reverse itself with a breach of the descending channel, a development that might test the immediate resistance.


