
Bitcoin’s recent rally was delayed but it arrived nonetheless; the price shot up by ~16% in 3 days to $8,436. However, the rally has stopped and reversed as the retracement continues. This can mean two things for Bitcoin, a short retracement prior to another pump; exhaustion of the surge. The latter seems more plausible due to different moving parts and their sway over the price.
Pause, not an end
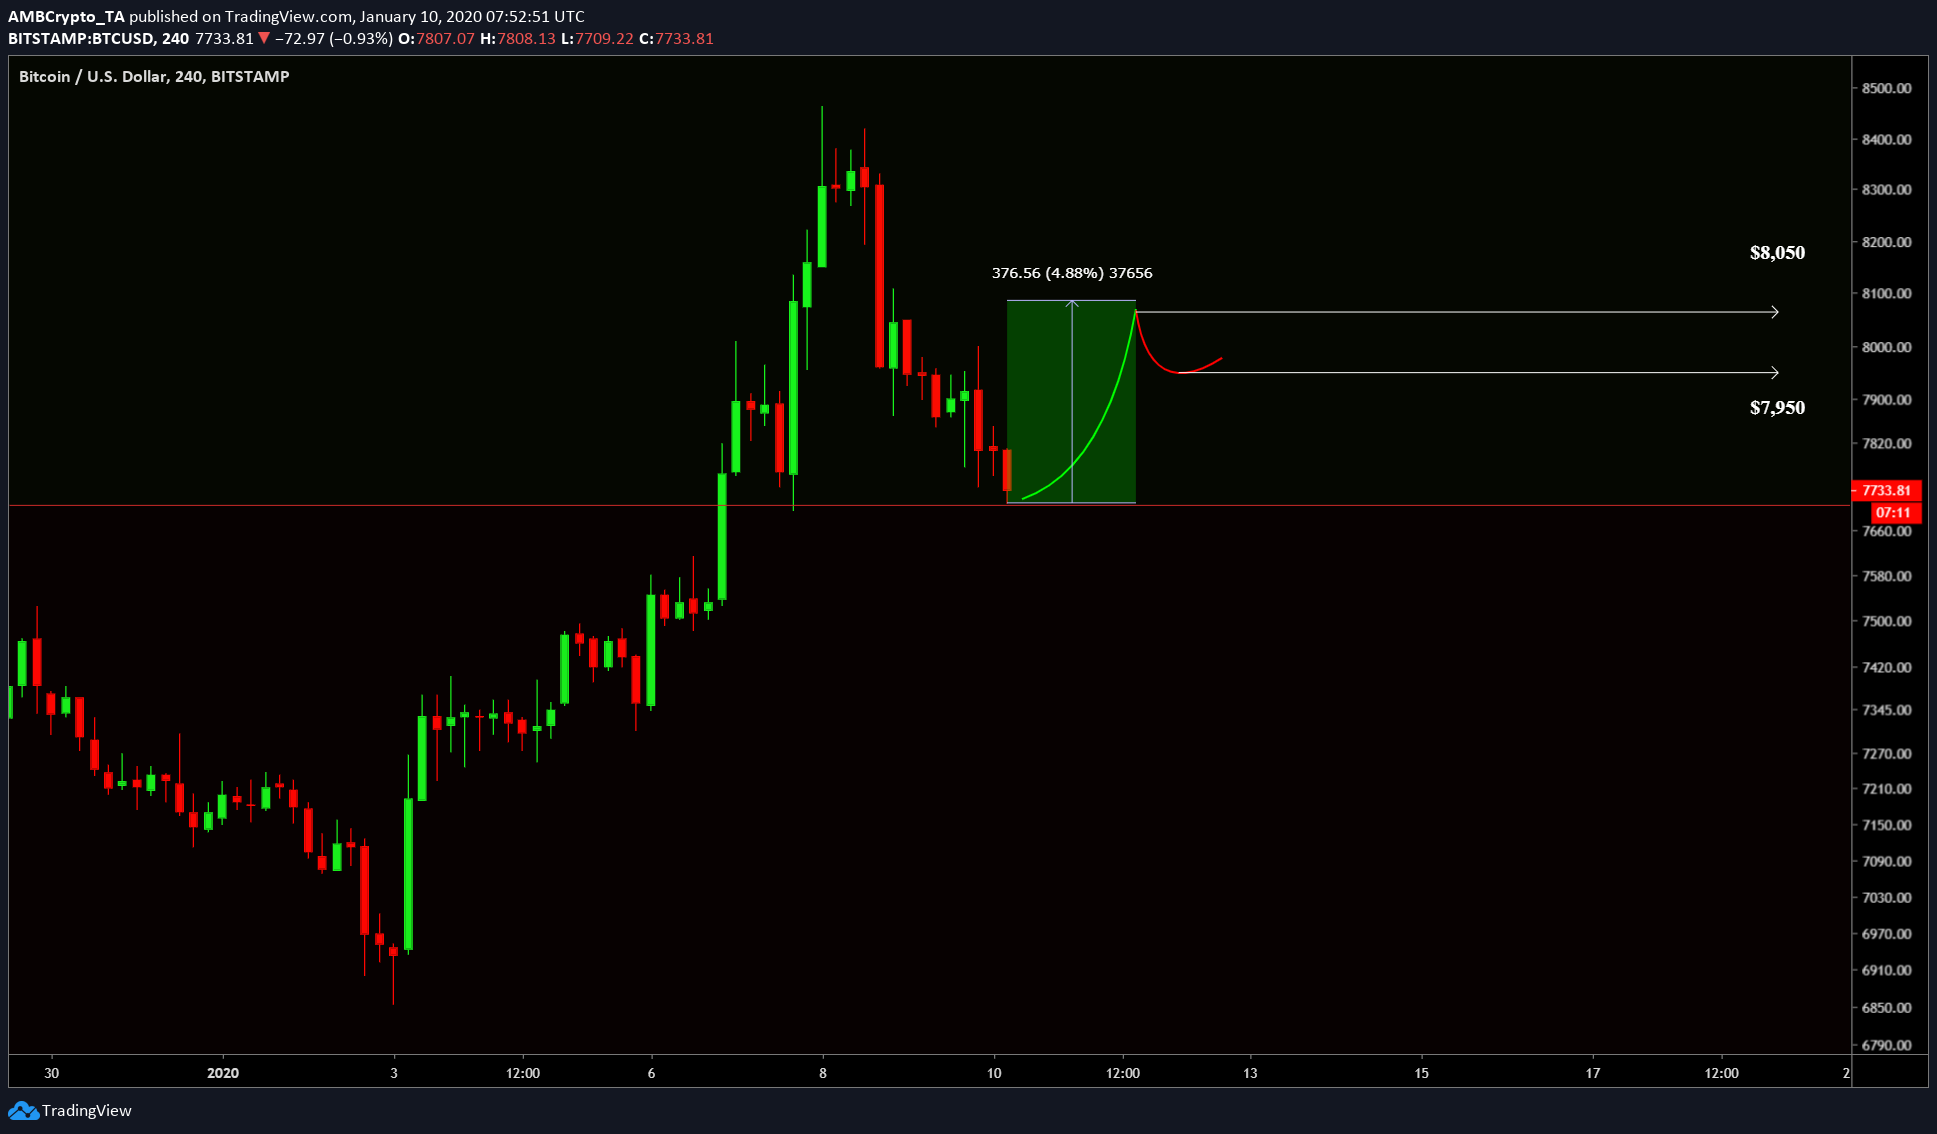
Source: BTC/USD TradingView
On a smaller time frame of 4 hours, a setup for a tiny rally has already been completed. The price should typically bounce from the $7,705 level [support] and rally up to $7,978, possibly up to $8,050. There are chances of price dipping under the support briefly and then rallying as mentioned above.
Bitcoin’s Evanescent Rally?
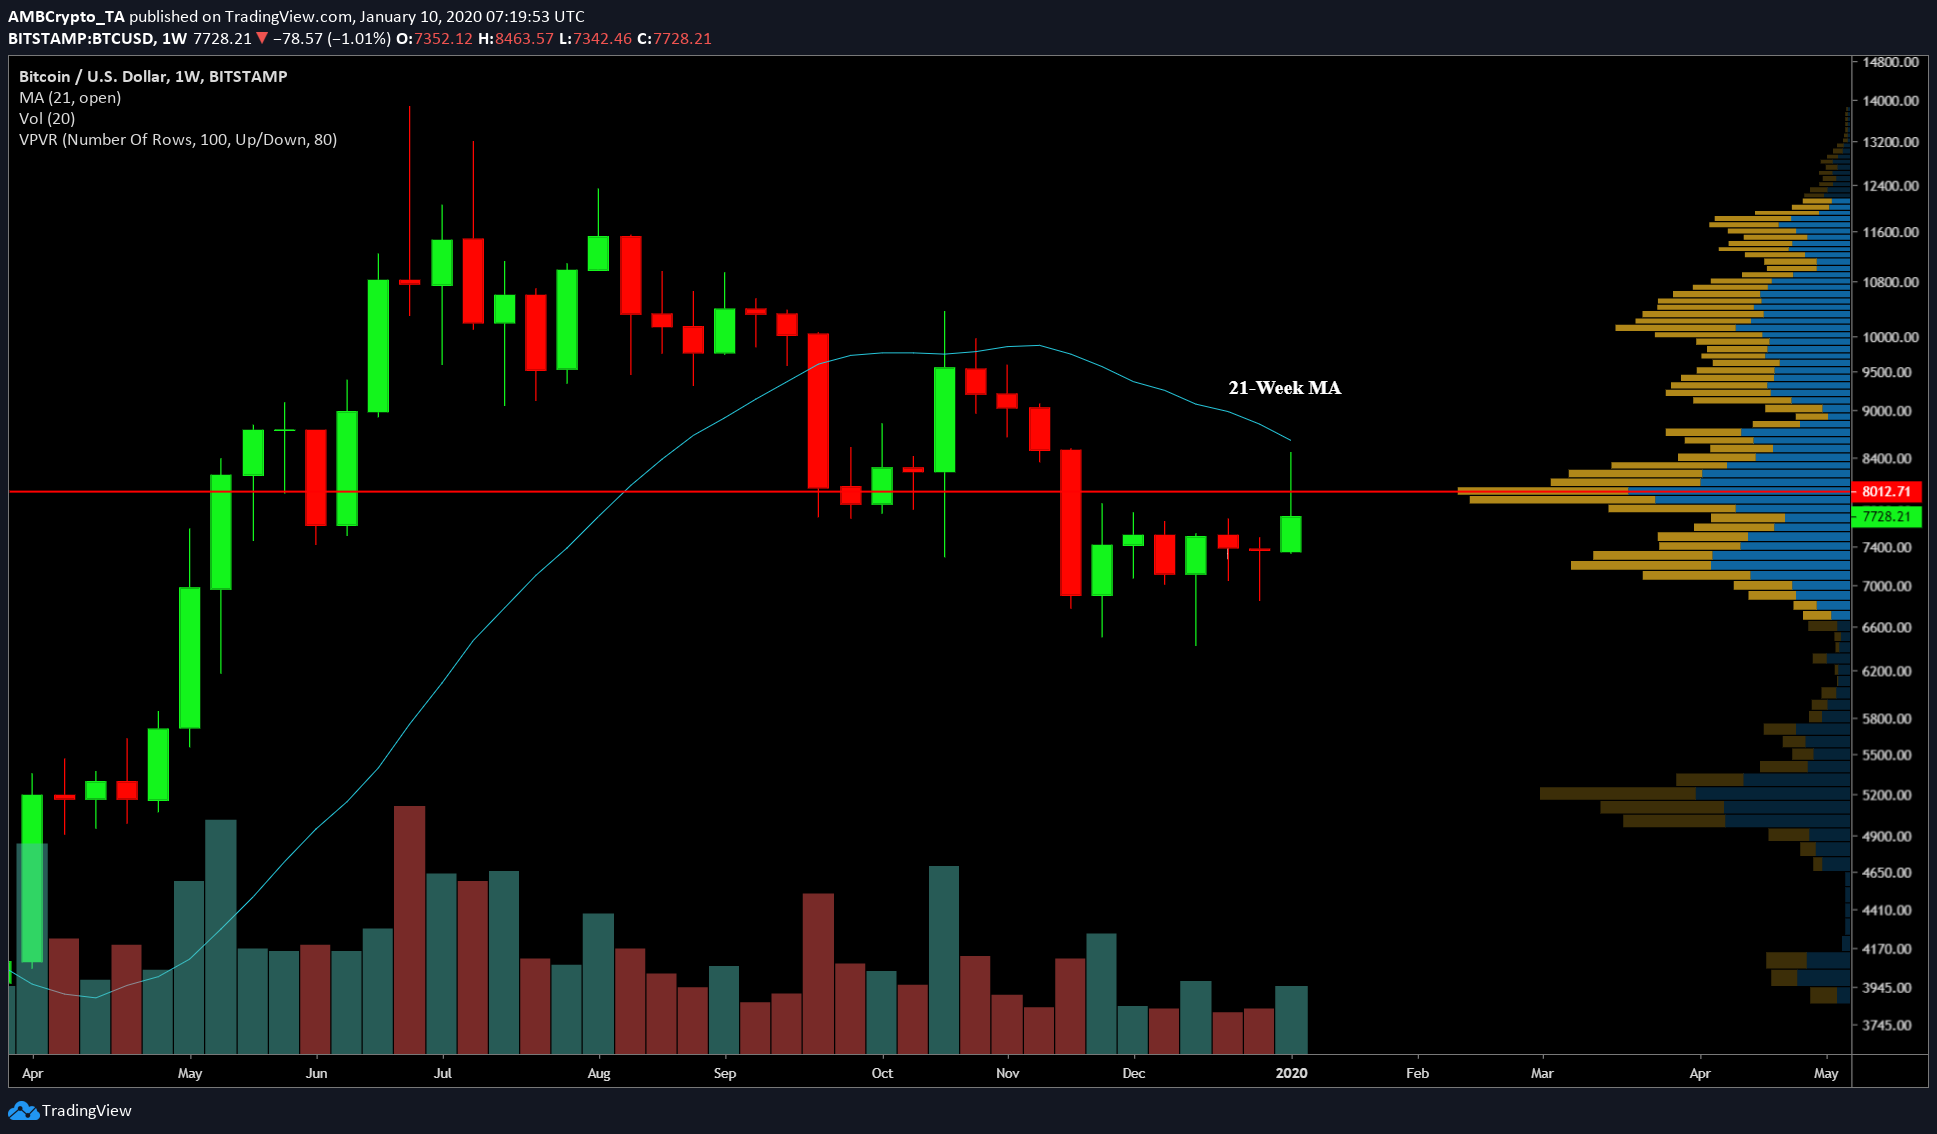
Source: BTC/USD TradingView
At press time, Bitcoin’s weekly chart is exuding the exhaustion of the new year’s rally with a long top wick and a small body. Moreover, the long wick fell short of a meetup with the 21-week MA. Had BTC crossed this, it would have been a massive bullish confirmation. Considering 9 months of trading data [starting from April 2019], the VPVR indicator showed a strong resistance at $8,000, which further explains the receding bullish pressure. The weekly candle’s body keeps shrinking, which is an indication of receding buyer pressure and a simultaneous increase of sellers.
There is, however, the case of Bitcoin’s volatility, which could easily flip the bearish scenario into a bullish one or vice versa, since the weekly candle has three days to close.
Bulls’ Vanishing Act?
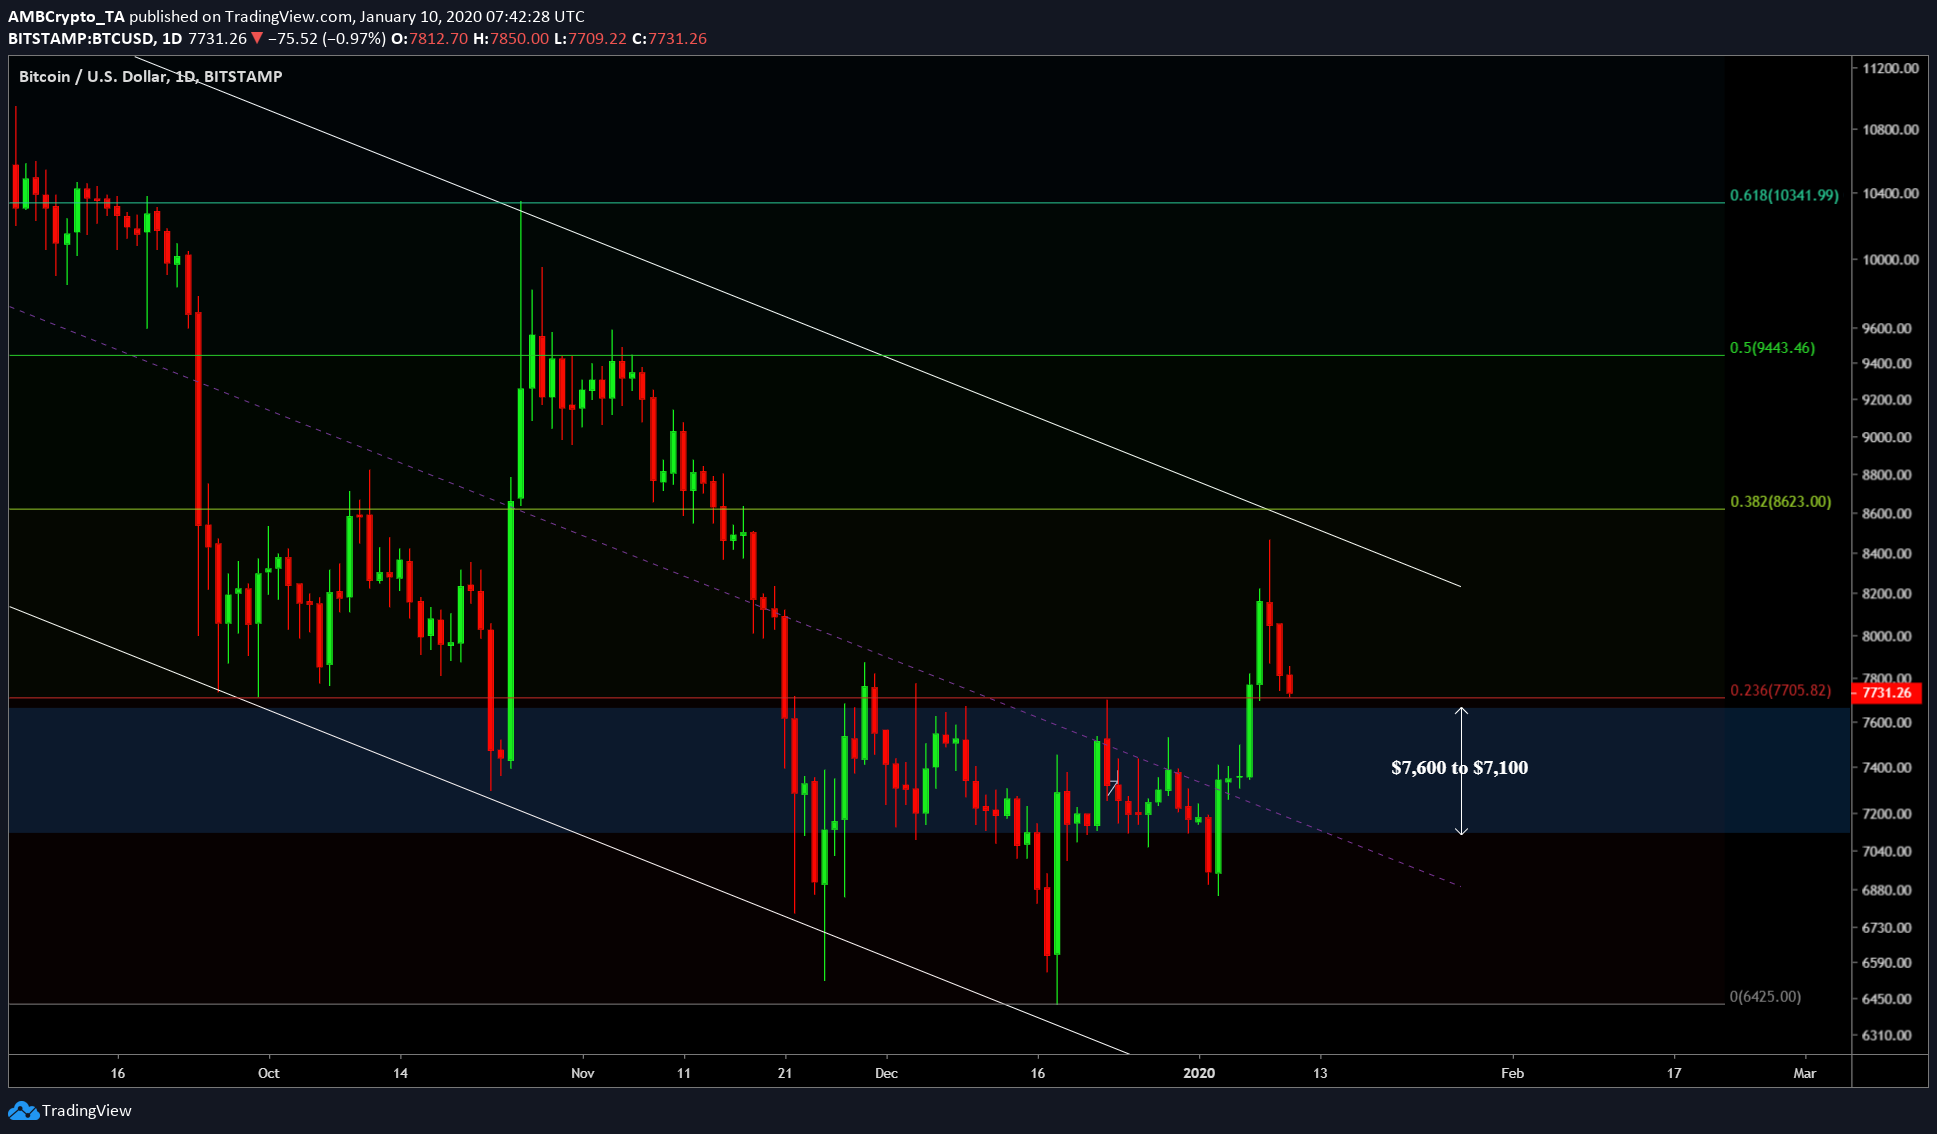
Source: BTC/USD TradingView
As BTC retraces from $8,400, the price seems to be facing a strong support at $7,705. Coincidentally, this support is also seen as the 0.236-Fib level. On one hand, breaching this support with a strong volume would be dire for the buyers. This could also stir up a watershed moment allowing Bitcoin to re-settle between the $7,600 to $7,100 area [blue rectangle area seen in the chart].
On the other hand, if price bounces off this support, there is a chance for Bitcoin to rally up to $8,600 after clearing important levels [$8,200, $8,400, and 21-week MA].
Conclusion
The weekly chart for Bitcoin looks massively bearish, however, with 3 more days for the candle to close, anything might happen.
The daily time frame is realistic, there’s a slightly higher chance that Bitcoin might dip lower, breaching the support at $7,705 and settle anywhere between $7,600 to $7,100.
The hourly chart for Bitcoin shows a small rally of 5% [$8,050].


![Real-world assets [RWA]: How to invest in Gold & Real Estate on-chain](https://eng.ambcrypto.com/wp-content/uploads/2026/02/Samyukhtha-5-400x240.webp)