Bitcoin’s contrarian look: A bullish pattern to breakout in near future

The cryptocurrency market remained dull since the massive decline on 24th September and since then the waves of market corrections have halted any efforts of Bitcoin and altcoins in their attempt to regain lost ground.
Bitcoin has been struggling to maintain its position above $8,000 and its price saw another dive below the $8k mark today. At press time, Bitcoin was trading at $7941.54 with a decline of 1.31% on the 24-hour price chart.
1-Day Price Chart

Source: BTC/USD on TradingView
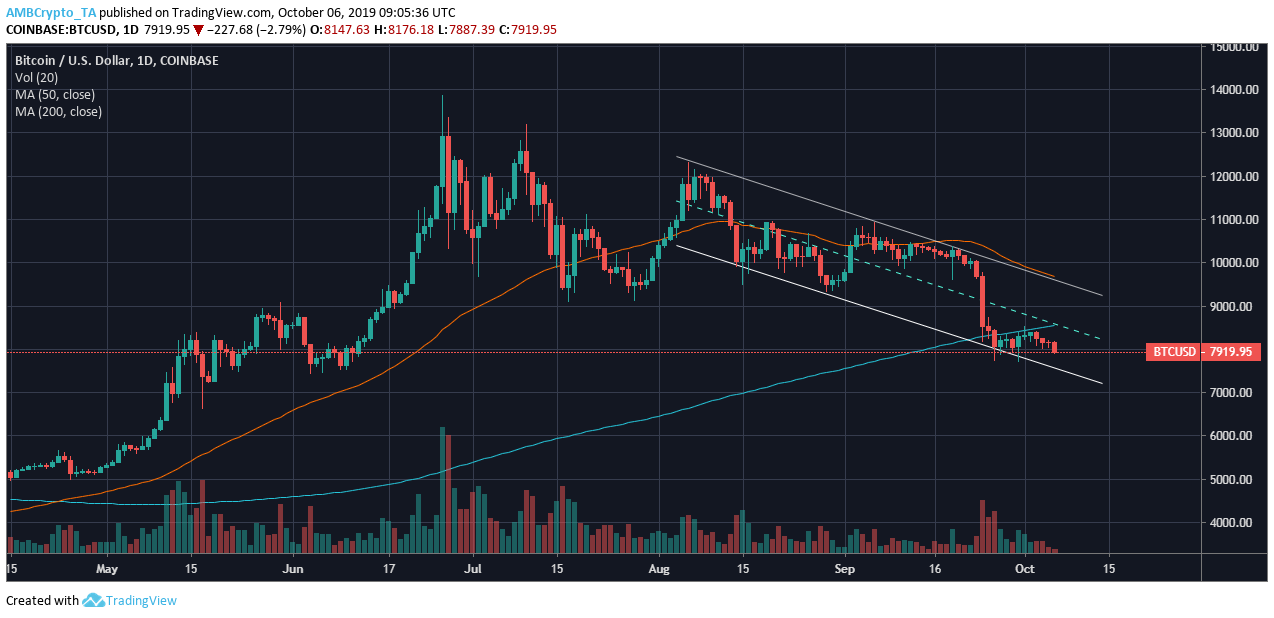
Bitcoin formed a descending channel on the 1-day price chart, characterized by two parallel lines forming lower highs and lower lows. Lower highs were registered at $12,307, $10,926 and $10,414, while lower lows were marked at $9289, $8215 and $8189. A descending channel is often followed by a bullish breakout which means, in the long-term Bitcoin price might shoot up.
50 moving average exhibited a golden cross in April and since then it has remained above the 200 moving average. This indicated that the market sentiment might remain bullish in the long term, even though short-term sentiment appeared bearish. The price was moving below the 200 moving average since September’s massive fall, which is bearish; however, the volatility has been low and BTC might flip the narrative and go above the 200 moving average.

Source: BTC/USD on TradingView
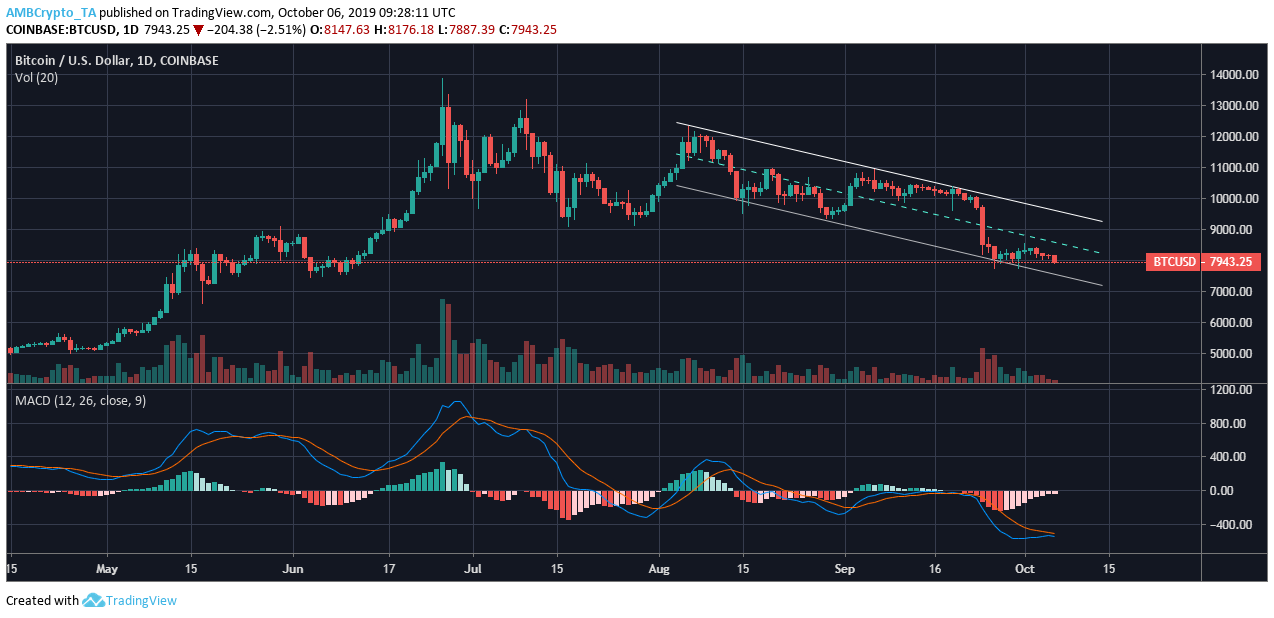
MACD indicator suggested a probable bullish crossover in the near future. This bullish crossover falls in line with the descending channel mentioned earlier.
Conclusion
Bitcoin looked bullish in the long term with the formation of a descending channel, which is often followed by a bullish breakout. MACD line was also set for a bullish crossover, suggesting an overall bullish sentiment.


