Analysis
Bitcoin’s breach of descending channel supports bullish breakout
The cryptocurrency market, including the likes of Bitcoin, has been struggling to see any bullish movement since 24 September. Even today, Bitcoin began on a bearish note, with its prices going below the $8K mark again. However, towards the latter half of the day, Bitcoin and much of the altcoin market started to record some upward movement.
At press time, Bitcoin was trading at $8137 with a gain of 1.10% on the 24 hour price chart.
1-Hour Price Chart

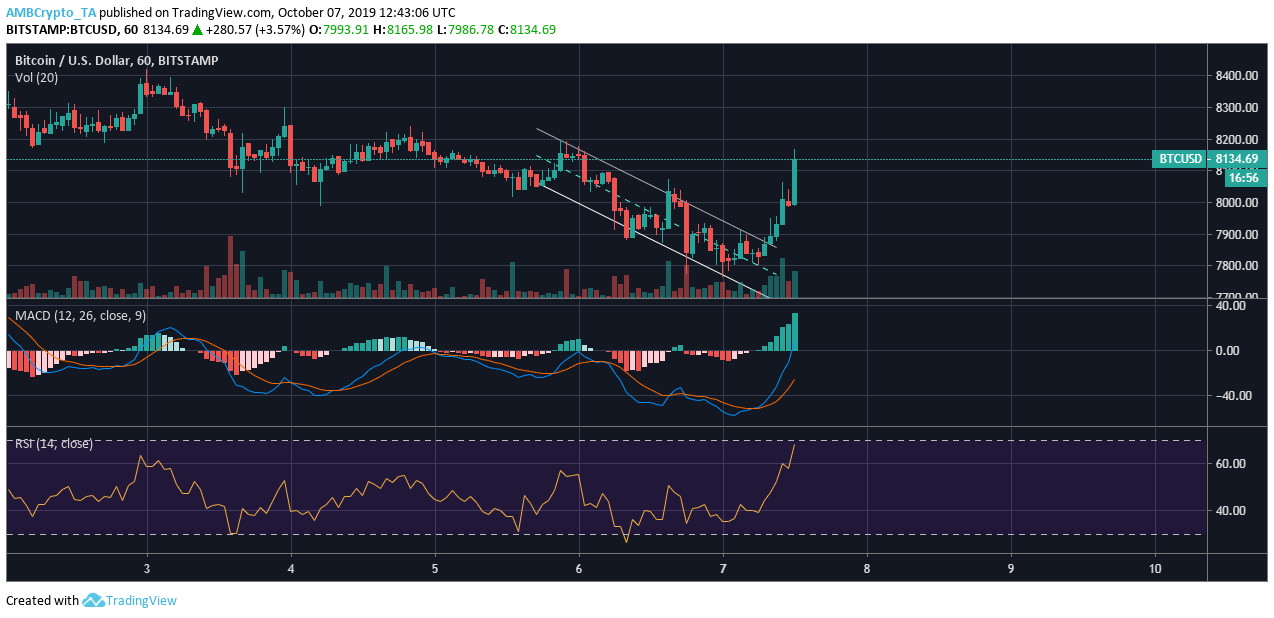
Source: BTC/USD on TradingView
On the 1-hour price chart, Bitcoin broke out of the descending channel which is characterized by two parallel lines, with lower highs forming at $8194, $8159 and $7912, while the lower lows met at $7870, $7817 and $7765. The price has already witnessed a bullish breakout, recording gains of over 5% in the last 5 hours.
The MACD indicator witnessed a bullish crossover today and since then, it has remained above the signal line. The RSI indicated that the bullish breakout has given an upper hand to the buyers, also suggesting that Bitcoin might get oversold before the end of the day.
4-Hour Price Chart
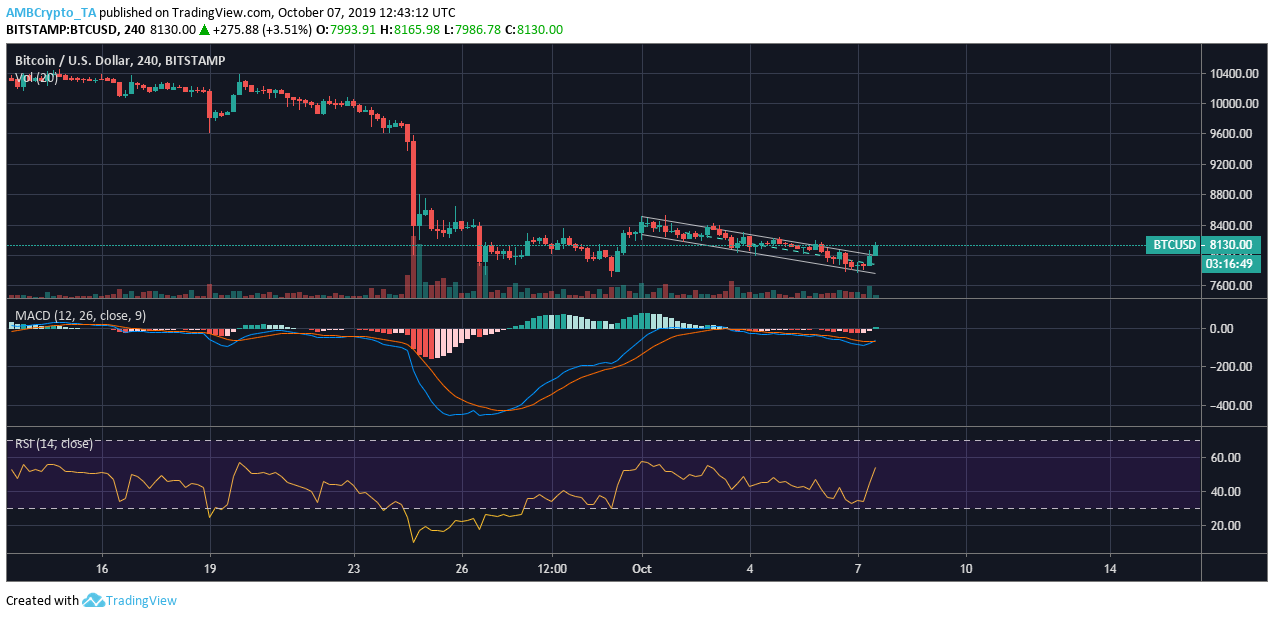
Source: BTC/USD on TradingView
On the 4-hour price chart, Bitcoin formed another descending channel and the price has just recorded a bullish breakout. The descending channel formed lower highs at $8520, $8325, and $8064, while lower lows were formed at $8180, $7803 and $7781.
The MACD indicator was set for a bullish crossover, something which might happen with the formation of a few more price candles. The RSI indicated a similar bullish sentiment, with the buyers having an upper hand in the short-term price market.
Conclusion
Bitcoin saw a bullish price breakout in the short-term on both the 1-hour and 4-hour charts, wherein buying pressure is much higher after almost two weeks. Bitcoin looked highly bullish in the short-term.


