Bitcoin to stabilize above $8,000 as it’s set to breach descending channel

Bitcoin has been struggling to maintain its position above $8k ever since the massive drop on 24th September, although the digital currency peaked as high as $8,800 on 11th October, the wave of market corrections neutralized those gains.
At press time Bitcoin was trading at $8001.74 seeing a minimal downfall of 0.22% on the 24-hour price chart. The market cap of the cryptocurrency stood just above $144 billion mark.
4-Hour Price Chart

Source: BTC/USD on TradingView
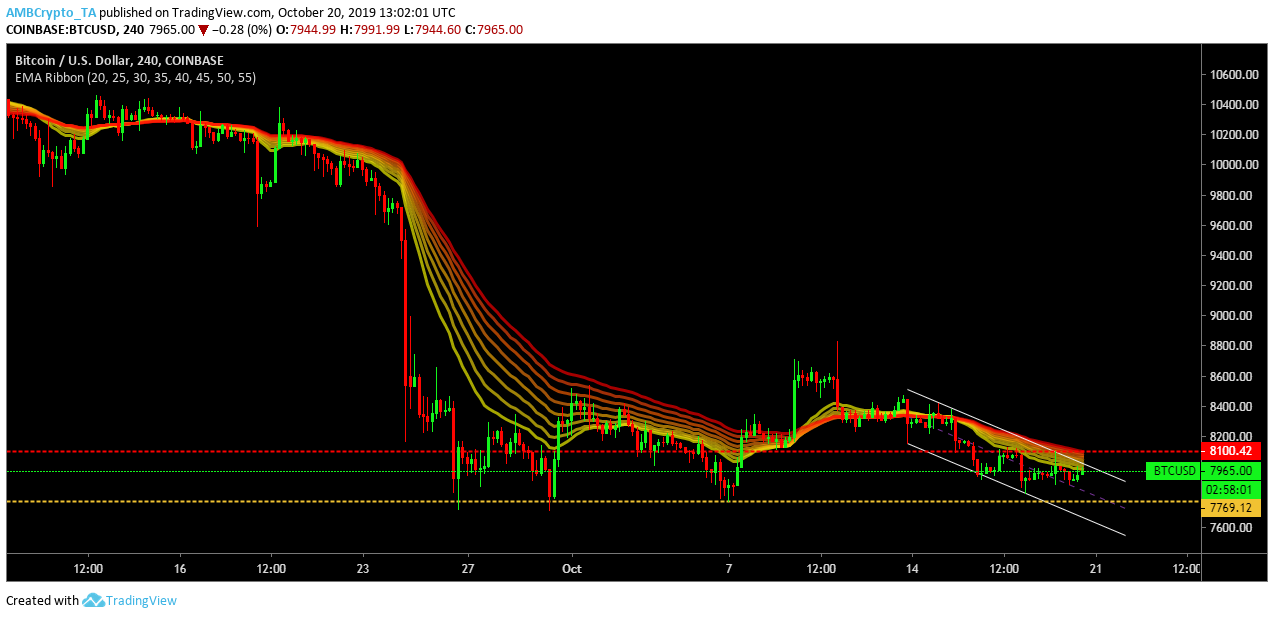
On the 4-hour price-chart Bitcoin formed a descending channel pattern which is considered a bullish sign as the breach from the pattern is often seen in an upward direction. The descending channel is characterized by the formation of a parallel descending channel with higher lows meeting the channel at $8,428, $8,377 and $8,076. The lower lows met the channel at $8,149, $7,959 and $7,819. Thus, Bitcoin looked for a bullish short-term burst if it managed to breach the descending channel.
EMA ribbon suggested increased volatility in Bitcoin’s price since 15th October and the ribbons were acting as a resistance, but the prices might move above the ribbon once it breaches out of the descending channel.

Source: BTC/USD on TradingView
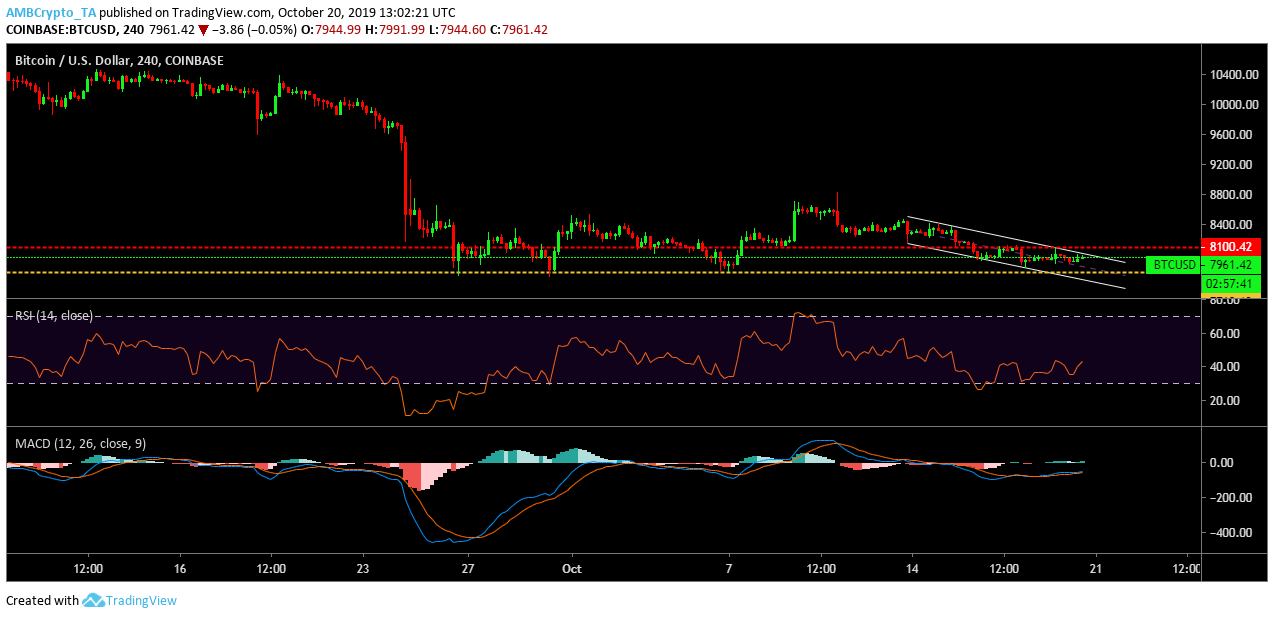
RSI indicated that even though selling pressure was high since 14th October, buyers have started to make their move and might have an upper hand if Bitcoin managed to breach the descending channel pattern. MACD line had a bullish crossover yesterday when the prices went above $8,000 and it has maintained its position since then which suggested bullish sentiments were higher.
Conclusion
Bitcoin was looking bullish in the short-term with the formation of descending channel pattern and the RSI indicator suggested that buyers were trying to get an upper hand in the market, while the MACD indicator suggested bullish sentiments were more prevalent in the short term.


