Analysis
Bitcoin takes a beating; primed for a drop below $7,000

It was only a month ago that Bitcoin saw a 40 percent daily gain, broke past the $10,000 mark and was set for a bullish end to 2019. Alas, the cryptocurrency world is not as straightforward as it seems, but few expected the recent crash to take the price as low as it has.
On November 22, thanks in part to the derivatives market, FUD and news coming from Beijing, Bitcoin dropped from $8,500 at the beginning of the week and at press time it stood just above $7,100. This drop has taken Bitcoin to its lowest point since May 2019.
Feeling the Squeeze

Source: BTC/USD on TradingView
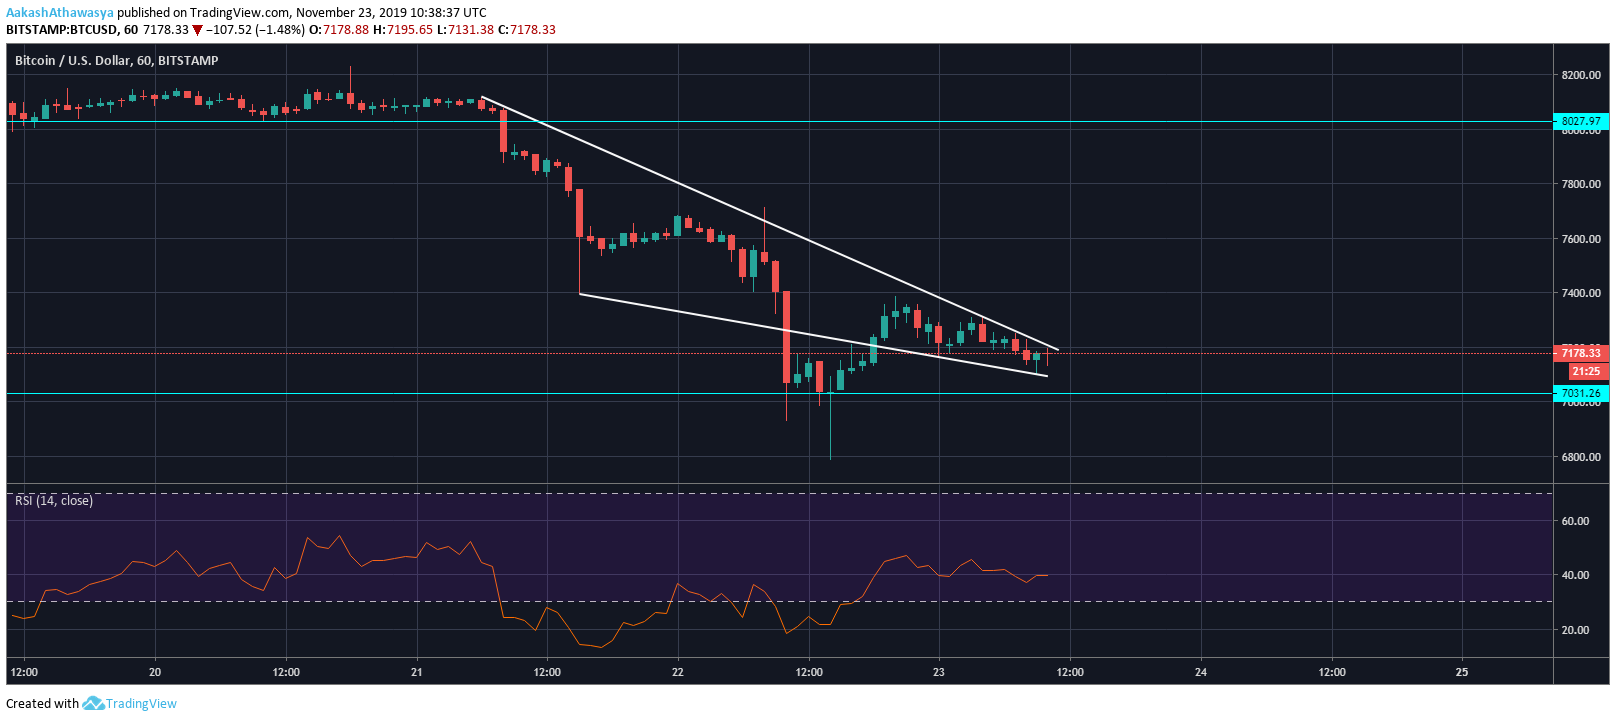
In the short-term, Bitcoin is rightly feeling the squeeze. Since breaking down below the $8,000 level on 21 November, a falling wedge began to form, taking the prices down by close to 12 percent in the past few days. The brunt of the drop occurred between 0900 UTC to 1100 UTC on 22 November as the price dropped by 5.84 percent within the two hours.
A slew of regularly dropping higher-lows were seen at $8,080, $7,600, $7,300 and $7,150. On the other hand, lower-lows were seen at $7,400, $7,150 and $7,090. The price did not strictly fall into this level, with the period following the aforementioned 5.84 percent drop leading to Bitcoin going as low as $7,032, its lowest price point since 12 May.
Bitcoin, at press time, is close to the upper resistance level of this wedge and will likely break it, given the two candlesticks that have just formed. However, the wedge is unlikely to break because of a mild breakout given the severity of this price action and the inability for the price to stay-put outside a certain support or resistance level based on non-fundamental or adoption factors.
The recovery of Relative Strength Index [RSI] shows a return of investor confidence but the RSI of 39.52 is still close to the oversold zone on 30, and hence a continued move up is essential for price recovery.
Support Fallout
Source: BTC/USD on TradingView
One of the most important observations in the 1-day chart is Bitcoin’s fall below a key support level. The level of $7,230 has been persisting since 12 May, with Bitcoin testing it consistently. On two occasions, 18 May and 23 October, Bitcoin bounced off this level, but the recent price decline has taken it below it signaling the coming of a prolonged bearish spree.
The imposition of a further price drop can be concluded from the pattern formed in the aforementioned chart. Since the close of October, when Bitcoin rose from $7,500 to $10,500, a falling wedge has been forming. The pattern further solidified with every consistent drop from the October high. Lower-highs can be observed at – $9,300, $9,000, $8,500 and $8,100. Lower-lows were seen at $7,300, $7,100 and the wick of the November 22 candle – at $6,700.
At the moment, there seems to be no obvious support level below $7,200, but the psychological level of $7,000 will play an important role in determining how Bitcoin will close the year. Since this wedge is quite acute, and will only close-off in mid-December, the price of Bitcoin can be estimated to drop by then.
If the above pattern is looked at as a descending triangle [similar to the September 23 drop], Bitcoin has already dropped below the base, and will continue to move downward.
Final Word
Over the past few weeks, Bitcoin’s price action has been governed more by external factors and pieces of sovereign communication, rather actual fundamentals, technical indicators, adoption [or lack thereof] and network activity. Due to the preponderance of these factors and Bitcoin’s sensitivity to the same, a price move cannot be indicated with assurance [Bitcoin did surge by 40 percent after entering the Death Cross, so you can never tell].
The price of Bitcoin is locked in a falling wedge, which primarily indicates a continued tumble in the price and eventual escape. In the long-term this escape could be somewhere in the next few weeks, with the price switching paths, either bottoming out and ending the year on a high or dropping to a seven-month low, most estimated are pointing to the latter.

