Disclaimer: This article attempts to analyze Bitcoin SV’s price movements over the next 24-hours.
Bitcoin SV posted a stunning rally at the beginning of the year climbing all the way to $415. However, the Black Thursday crash and the subsequent pullbacks have negated more than half of its gains as it continued to hover well below the crucial $200-mark. At the time of writing, the sixth-largest coin was being traded at $174.7.
Bitcoin SV 4-Hour Chart:
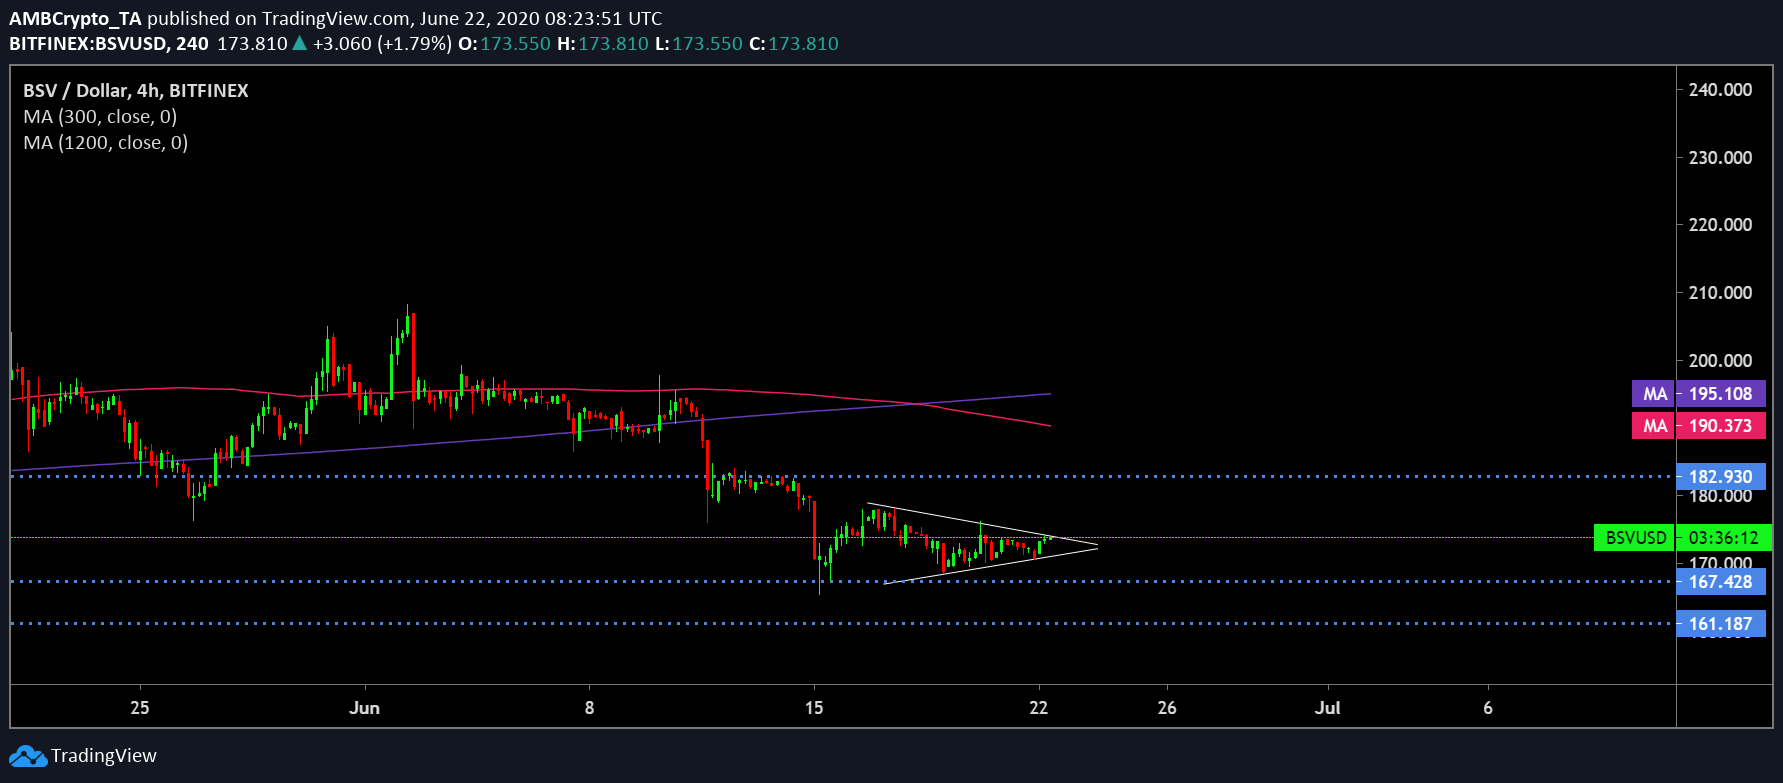
Source: BSV/USD on TradingView
The Bitcoin SV price candles were oscillating between the two trendlines of a symmetrical triangle, the completion of which was estimated to be in the next 24-hour. A breakout from this pattern formation could be on either side. The placement of the daily moving averages aligned with a bearish breakout in the near-term. The 50 DMA [Pink] underwent a death cross with the 200 DMA [Purple] last week. The gauge has since been increasing. In addition, both the DMAs were above price candles resisting a breakout on the upside.
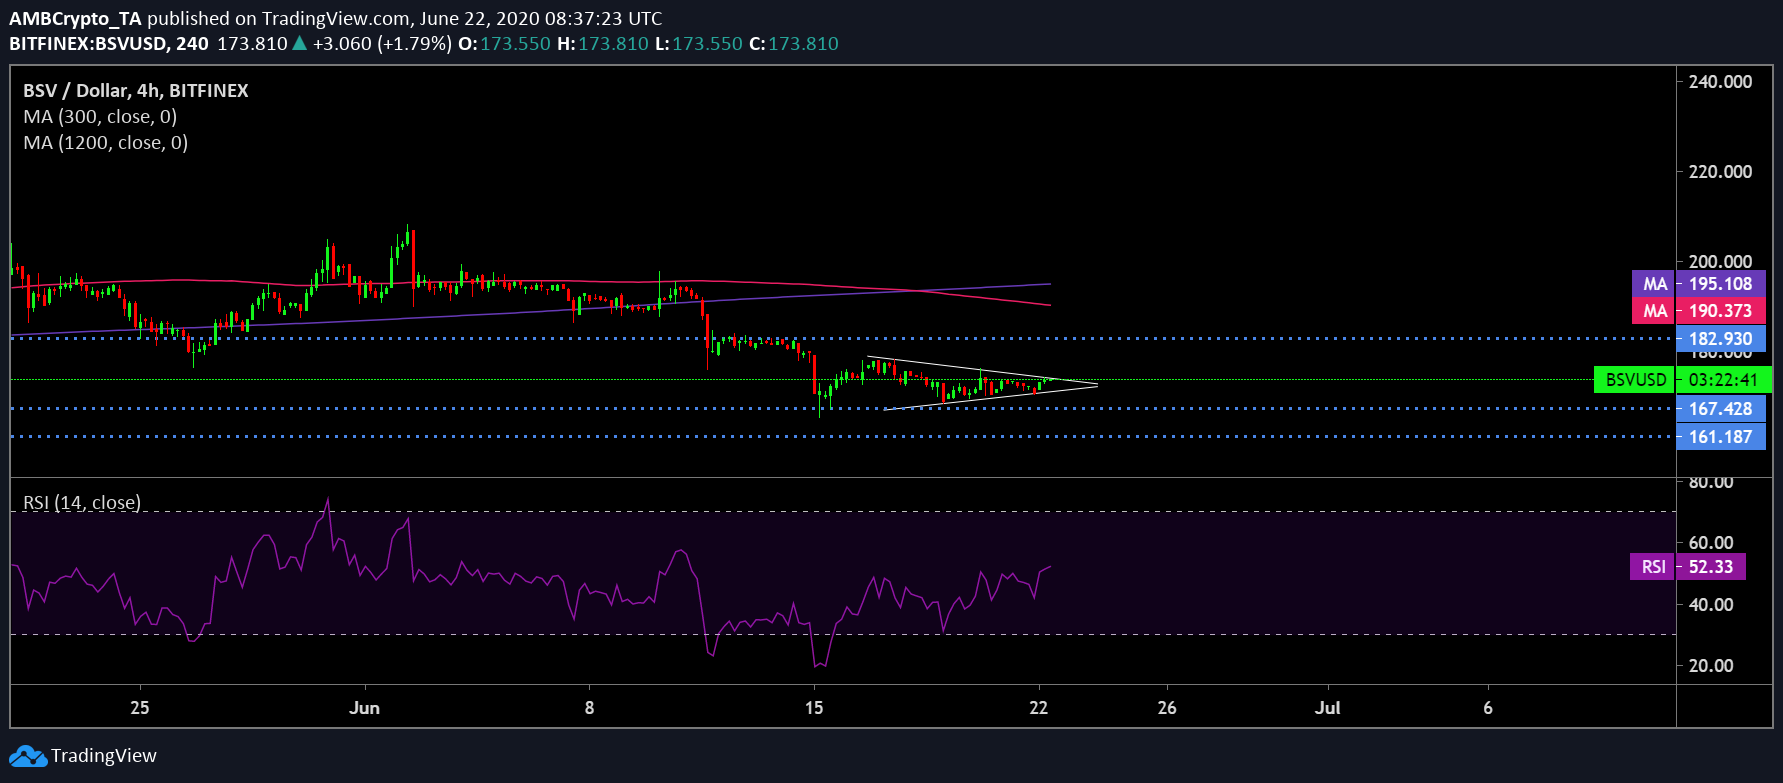
Source: BSV/USD on TradingView
The RSI noticed a minor uptick above the 50-median after hovering below it for quite some time. However, this surge could find a major resistance at the current level preventing it to further tread into the overbought zone as uncertainty continued to engulf the BSV market.
Correlation:
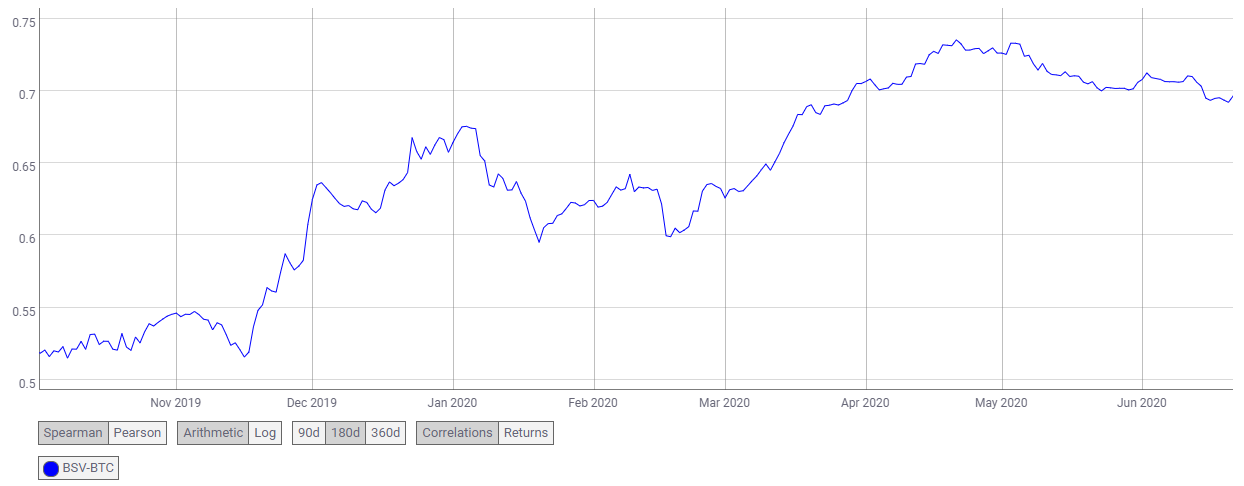
Source: Coin Metrics
Despite ideological differences between the two camps- Bitcoin and Bitcoin SV, the latter has closely followed the king coin’s price actions. According to Coin Metrics, the BSV-BTC correlation currently stood at 0.69. This essentially implied that Bitcoin’s surge could significantly help propel Bitcoin SV’s value in the near future as it was down by over 50% since its January-2020 highs.
Conclusion:
If the bearish breakout materializes within the aforementioned time frame, BSV could retrace to $167.4. A further downturn could drive the coin to retest at $161.8, a level not seen since the first-week fo March it found resistance at points $182.9 as well as the two moving averages at $190.3 and $195.1 respectively.