Disclaimer: The findings of the following analysis should materialize over the next 24-hours
Bitcoin SV, against all odds, has been able to avoid massive depreciation on the charts since hitting a high of $250 on 1 August. The crypto-asset maintained its consolidation between $218 and $230 over the past 24-hours and it is uncertain whether the following trend will break above or below over the next week. With Bitcoin’s value appreciating over the past 24-hours, the same sentiment was shared by BSV. However, a short-term re-test may soon be on the horizon for the popular Bitcoin fork coin.
Bitcoin SV 1-hour chart
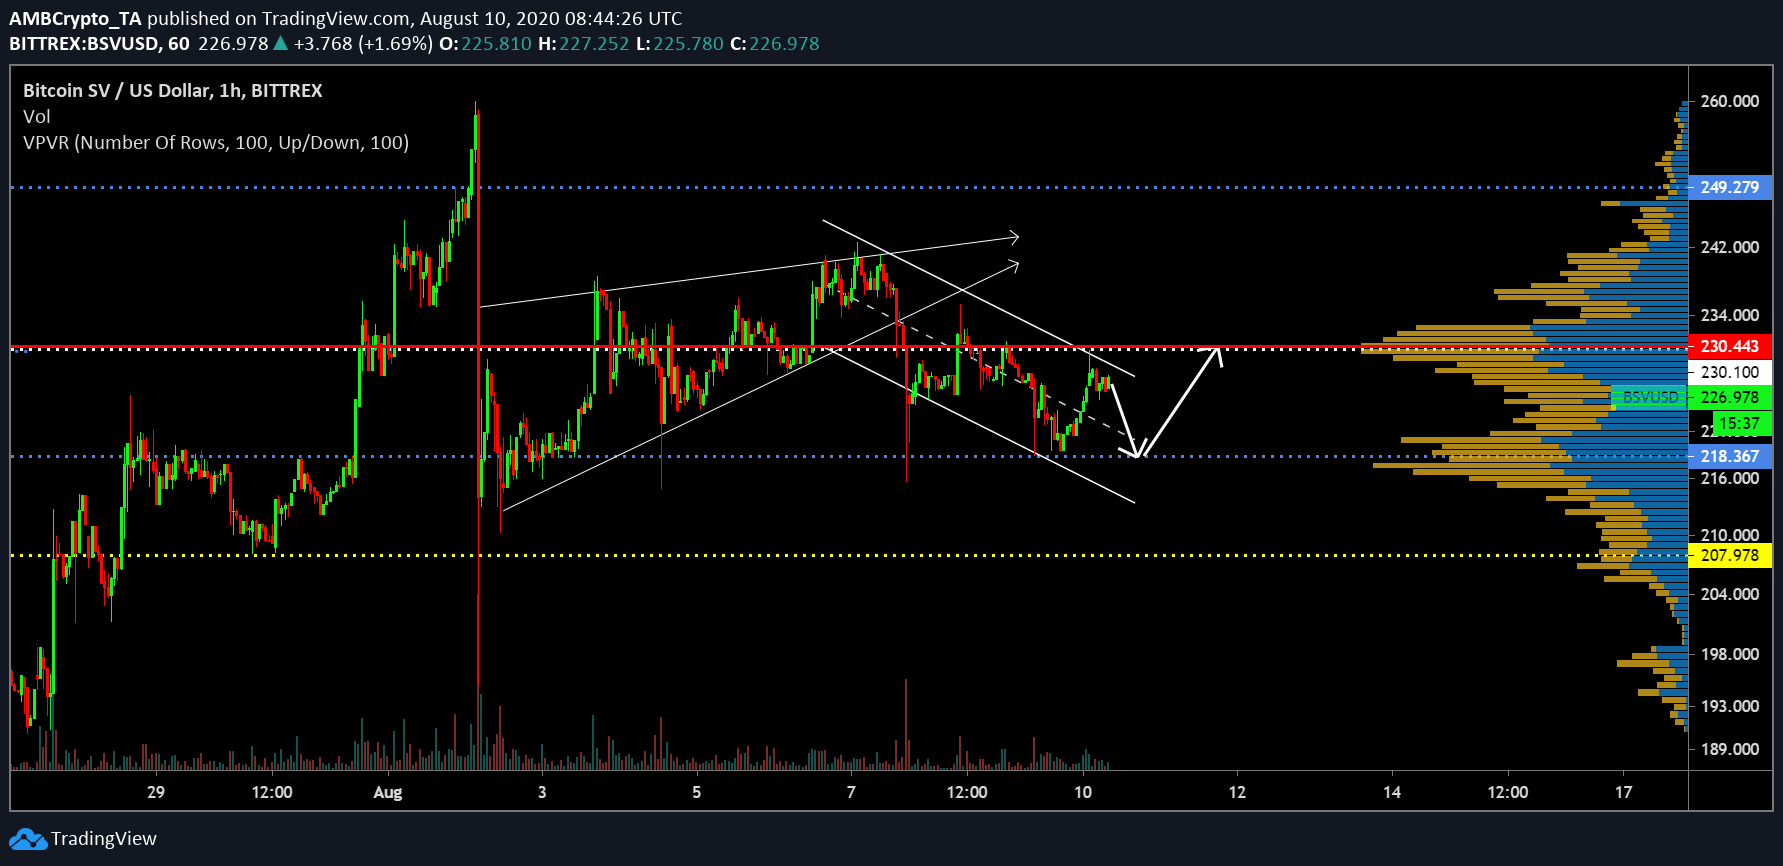
Source: BSV/USD on Trading View
Now, as expected from the previous week’s rising wedge pattern, Bitcoin SV’s price movement has transitioned into a descending channel over the past three days after registering a bearish breakout on the charts. The breakout from the rising wedge pattern did not force the price to drop down to $218, but on 9 August, the re-test was pretty close.
At the time of writing, keeping in line with the descending channel, there was a possibility that BSV might drop down again from its press time position of $226, before hitching on a proper bullish breakout towards $230.
Further, the VPVR strongly underlined the placement of the Point-of-Control at $230, implying that any breach above that particular resistance wasn’t going to be as likely.
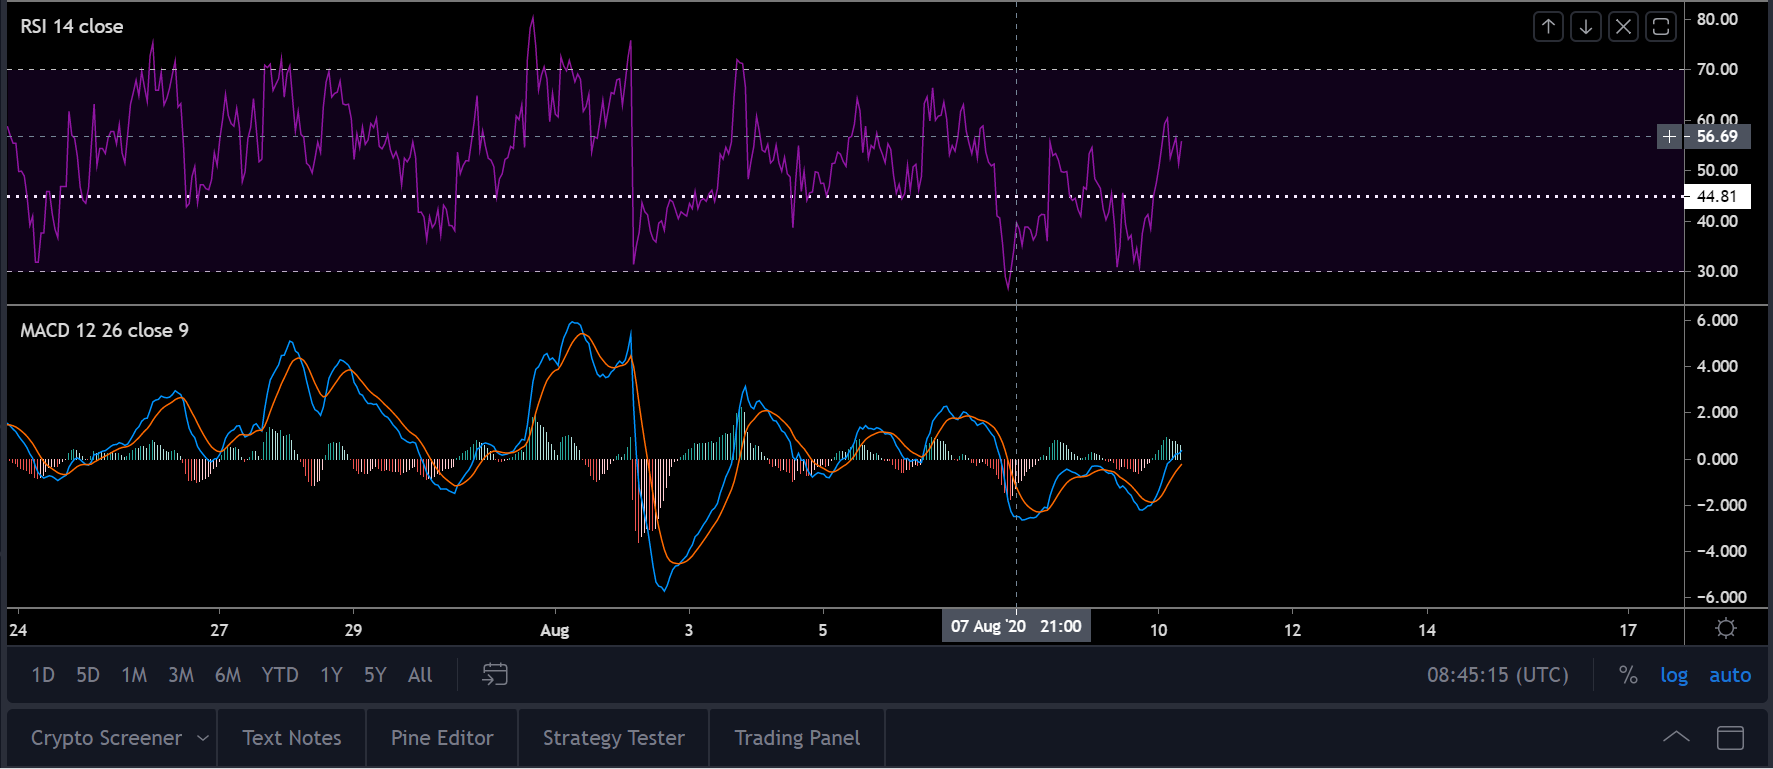
Source: BSV/USD on Trading View
An observation of major market indicators suggested that selling pressure is likely taking the indicator down to 44.81 before the buyers take charge of the rally towards the re-test. Further, the MACD appeared bullish at press time, but the red line was closing in to execute a trend reversal.
Bitcoin SV 4-hour chart
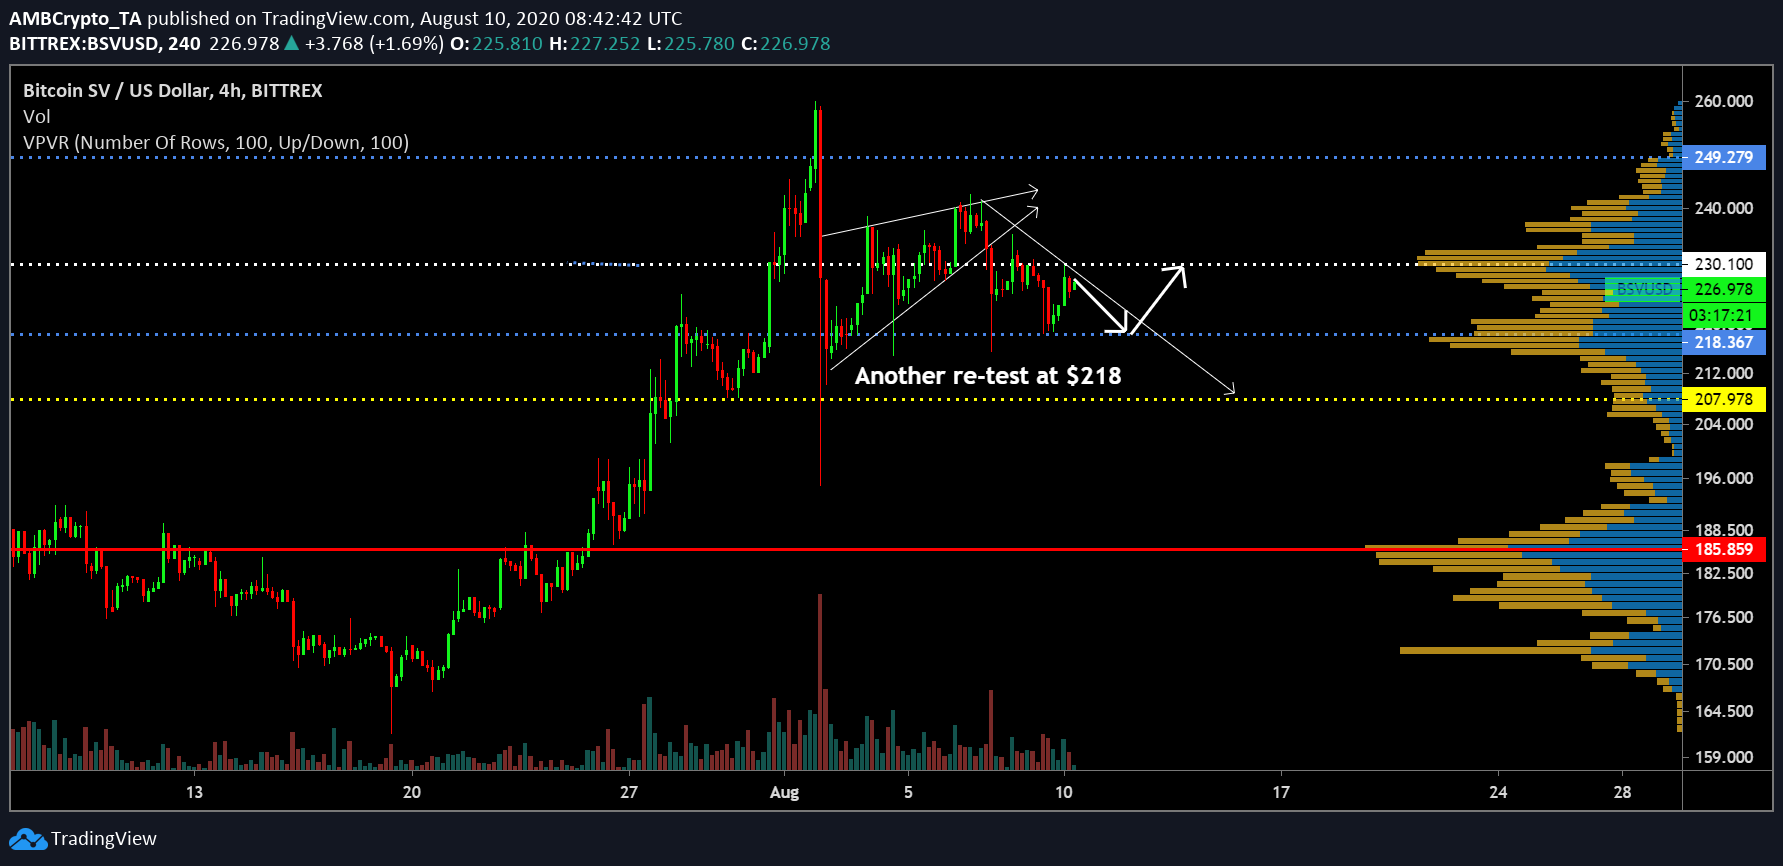
Source: BSV/USD on Trading View
Now, the 4-hour chart for Bitcoin SV highlighted the transparency of the trend and pictured BSV conforming to a downtrend since the breakout on 7 August. If the crypto-asset abides under the downtrend, a drop down to $218 should be seen over the next 24-hours.
As explained previously, the immediate re-test remained at $230 as the trading range between $218 and $230 has predominantly existed since the collapse on 2 August.
Conclusion
Bitcoin SV might re-test support at $218 over the next 24-48 hours in the short-term.