It seems like the market is finally turning a little bullish. Bitcoin pushed its own price above $11k and other altcoins were appearing to push their respective valuations as well. Bitcoin SV has registered 3 consecutive green candles over the past three days, taking its valuation above $165. With the trend reaching a possible breakout position, the price might attain a transition as well.
Bitcoin SV 1-day chart
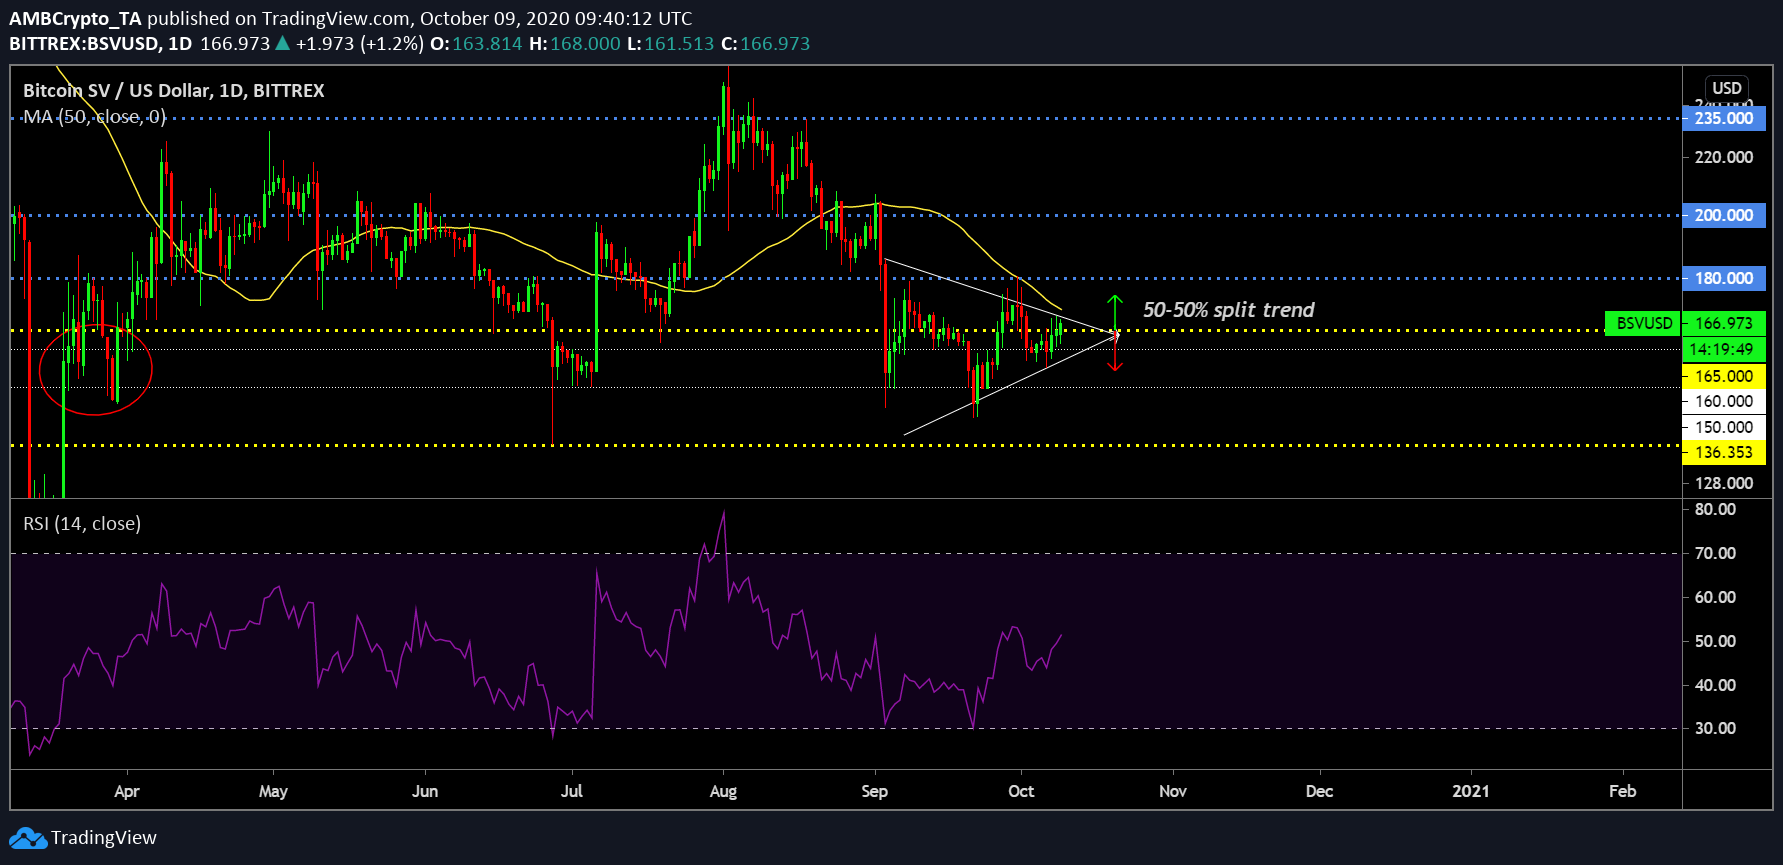
Source: BSV/USD on Trading View
Earlier, we had identified that Bitcoin SV’s price had reached a likely bottom between the range $150-$160, which has been a transitional range in 2020. After the collapse in September, the token has steered clear of that range, giving rise to a symmetrical triangle. while the price was shunted on its first attempt to breach above $180, the asset consolidated near and above $160. Now, with the pattern reaching an imminent breakout anytime soon, the trend is split even with regards to being bullish or bearish.
One major hurdle to break the bearish grip remains the strong 50-Moving Average at the moment. The MA has been thrusting high selling pressure since the middle of August, and the right now BSV is close to testing its overhead resistance yet again. While the bullish strength from RSI indicated that the buying pressure was re-gained momentum over the past couple of days.
Bitcoin SV downtrend since August 2nd

Source: BSV/USD on Trading View
Now, if the trend is estimated over the past couple of months including August, Bitcoin SV continues to be under the downtrend (white line) and as mentioned above, the 50-MA remains as an over-head resistance. Breaking down the possibility of both the trends, a bullish move would see the token test $180 once before exhibiting a pullback near $170, following which it might try to take-over $180 again.
From a bearish point of view, a re-test down to $150 will be followed by another tussle to break above $160-$165. With Stochastic RSI suggestive of a bullish move at the moment, the bulls might take charge over the next week, keeping at eye at the resistance at $180.