
Disclaimer: The following price prediction estimates Bitcoin SV’s imminent bearish pullback.
Over the past week, it is becoming increasingly difficult to estimate the breakout pattern of Bitcoin SV. The BTC forked coin seems hot-and-cold in terms of dependence on Bitcoin but its recent break above $217 may have indicated the underlining strength of its BTC-correlation. At press time, Bitcoin SV was valued at $238 with a market cap of $4.4 billion.
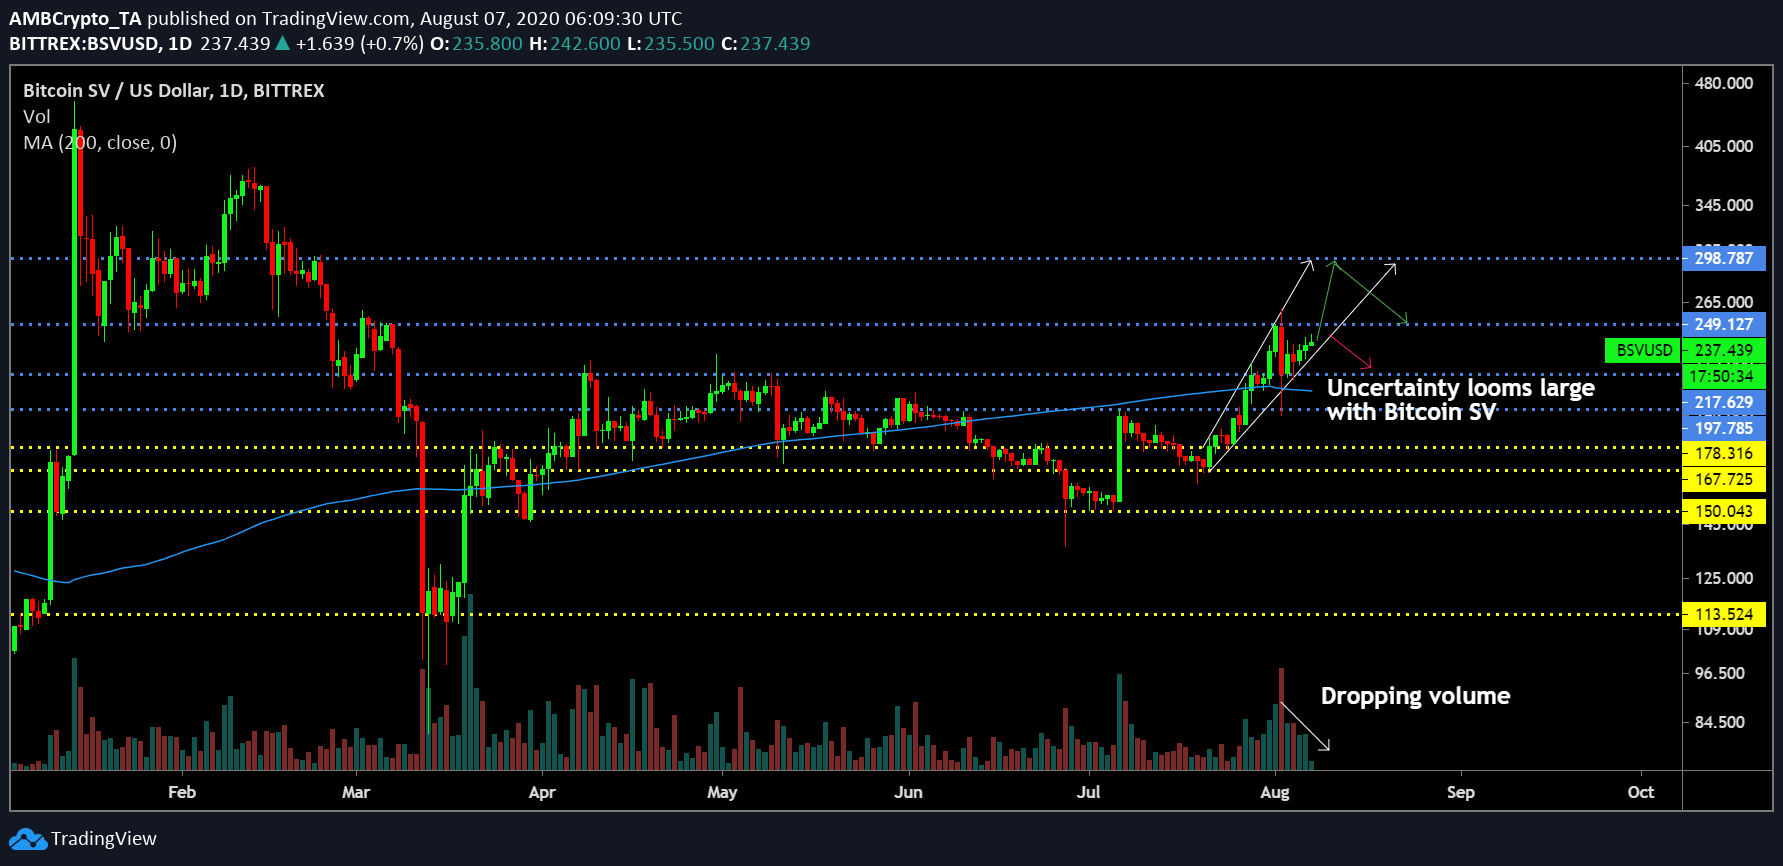
1-day chart
Source: BSV/USD on Trading View
After failing to break past the resistance at $217 for the greater part of summer, Bitcoin SV finally marched above this range on 1st August. Although it seemed like BSV’s resistance will come back into play when BSV dropped below $217 again, the asset managed to sustain a position above the aforementioned resistance on 3rd August.
According to the 1-day chart, the quick-bounceback was supported by the new 200-Moving Average, which is frankly a strong bullish sign. However, for Bitcoin SV, the trend has been largely unpredictable since the start of the year. With proponents trying to claim its legitimacy in the market, there is a definite correlation factor with Bitcoin, which is finally coming to surface. Over the past-day, Bitcoin was the only major asset to breach past its key-resistance at $11,500 and Bitcoin SV followed suit, unlike the rest of the industry.
With an ascending broadening wedge pattern currently painting the picture, a bearish breakout should be a logical turnaround over the next week, but the trading range remains an uncertain factor for the BTC-forked asset. The drop in trading volume also solidifies the weak rally taking place at the moment.
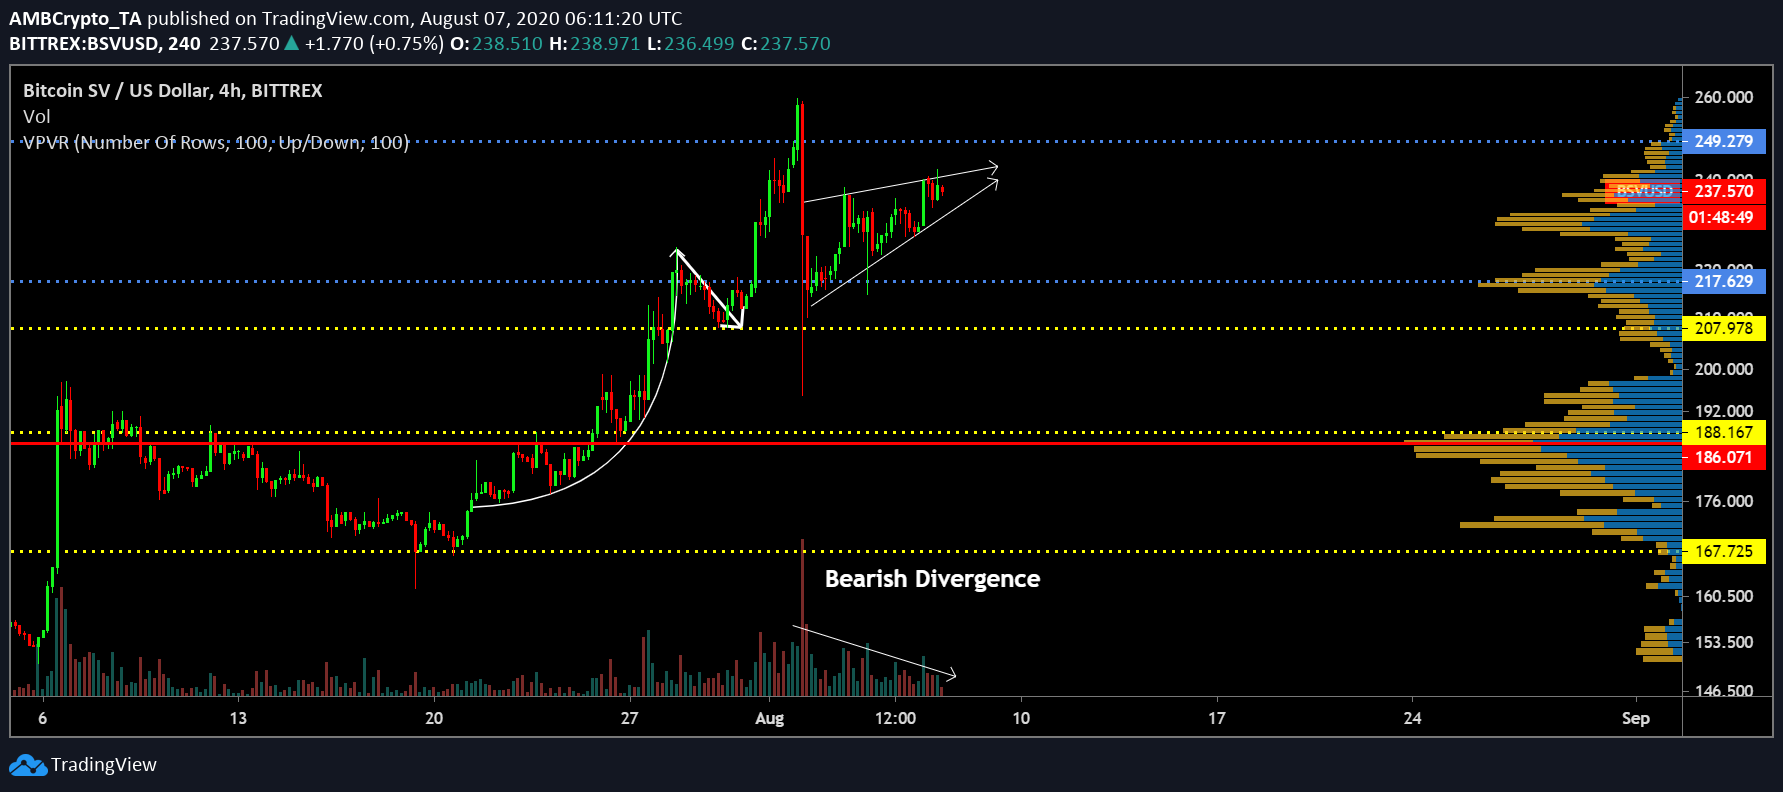
Bitcoin SV’s 4-hour chart confirms it.
Source: BSV/USD on Trading View
The rising wedge pattern for the asset does not go unnoticed in the charts, and according to the chart above, a breakout is certainly in the charts over the next week. The consistent drop in trading volume is a clear indication of a bearish divergence, which coincidentally is taking place with Bitcoin as well.
Hence, any doubts of BSV not being correlated to BTC is slowly starting to fade away and, and sooner or later, traders would be able to figure out a sell-point for Bitcoin SV. Over the next week, the asset looks prime to re-test resistance at $249, and with a little help, it may breach above the resistance as well.
However, a decline is possibly inevitable for BSV with on-chain fundamentals backing the apparent rally gets weaker and weaker every day.
Conclusion
Bitcoin SV will possibly trend between the range of $249 and $217 over the next week.