
Bitcoin SV registered a drop under $170 over the past 24 hours dropping down to $167 at the time of writing this article. The market appeared collectively bearish but after analysis, the relative change for Bitcoin SV appeared minimal as the asset seemed to maintain sideways movement over a long period of time.
At press time, Bitcoin SV had a market cap of $3.11 billion in the industry.
Bitcoin SV 1-day chart
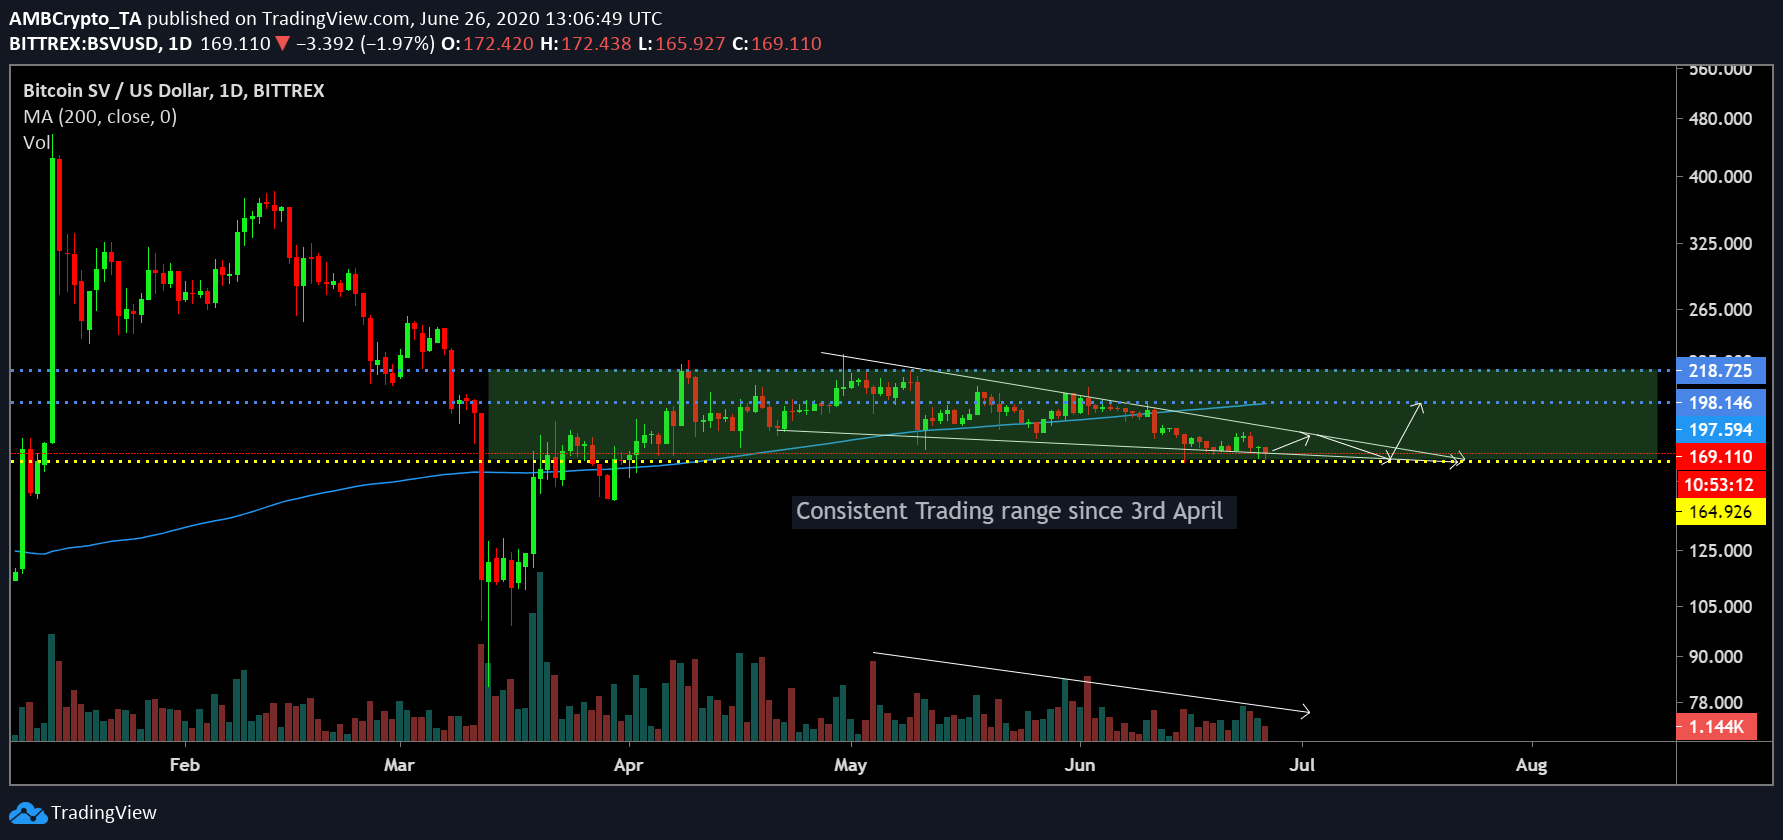
Source: BSV/USD on Trading View
Although Bitcoin SV declined over the past day, the asset’s long-term chart suggested that a strong consolidation between a range of $218 and $164 has been consistently maintained since 3rd April. On 8th April, BSV’s price peaked at $218 after the March collapse and even though other assets registered higher range deep into May and June, Bitcoin SV’s movement has remained under $218 ever since.
At the time of writing, a falling wedge pattern suggested BSV might register a rally but it is unlikely to go above the immediate resistance at $198. One of the major indicators of strong resistance at $198 is the fact that 200-Moving Average became an active over-head resistance on 11th June.
Bitcoin SV will possibly undergo a rally by mid-July, all the way up to $198 but a breach above $218 or $198 is a long-stretch.
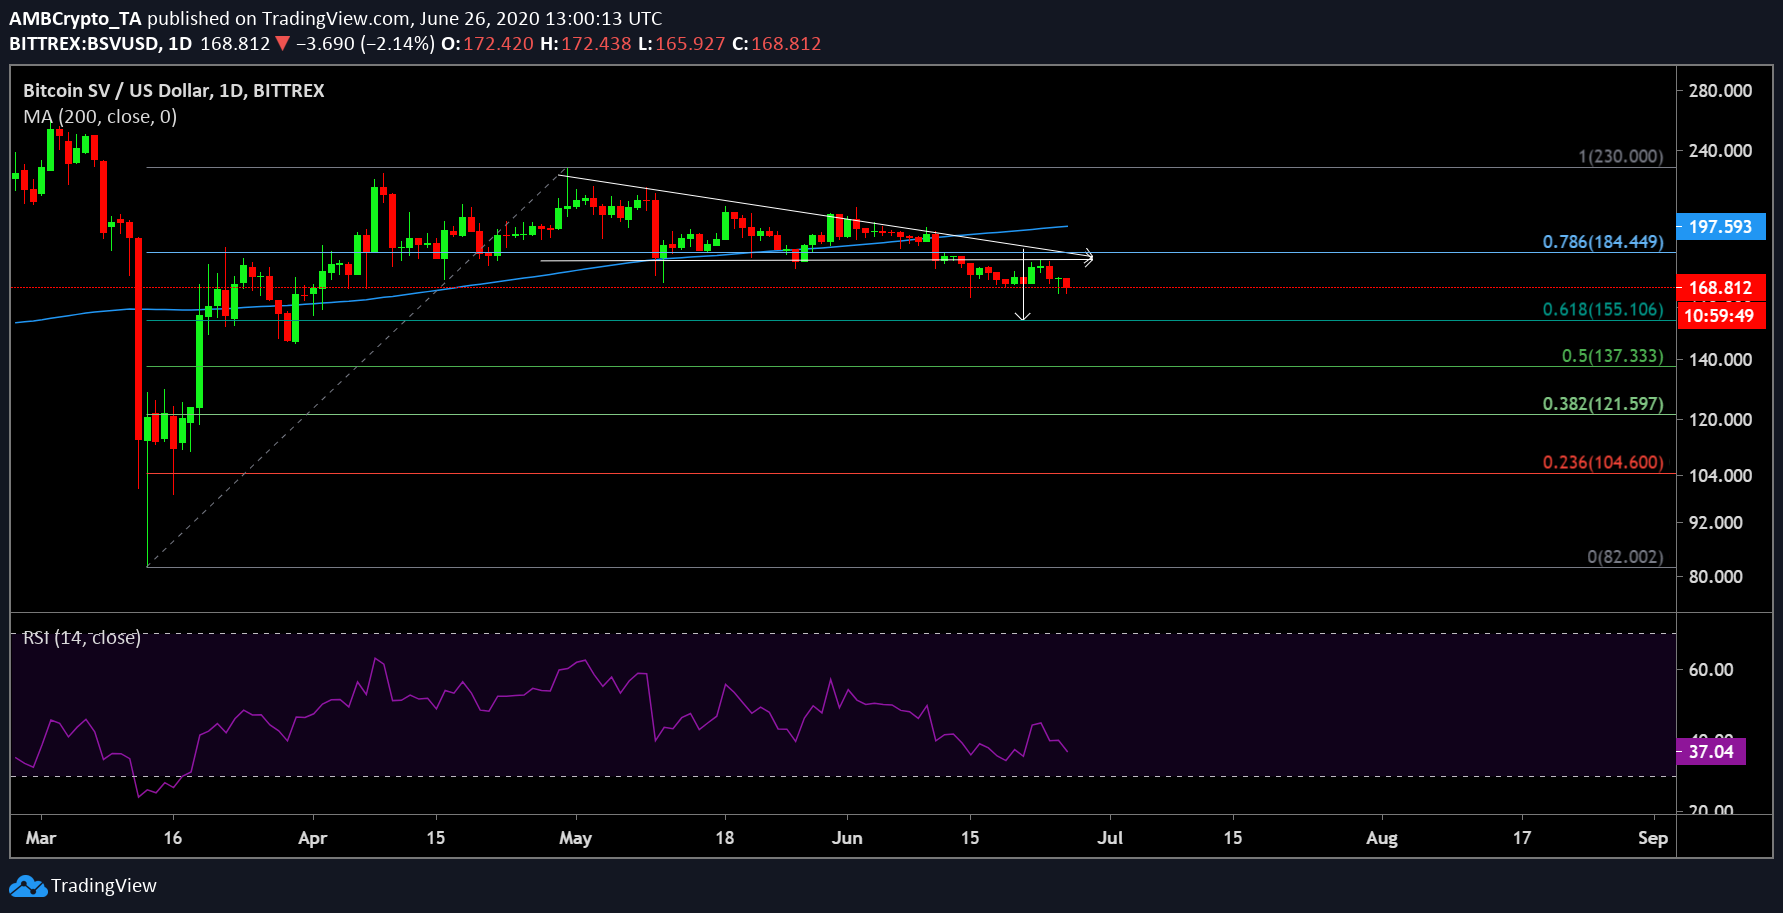
Source: BSV/USD on Trading View
It can also be identified that the trend reversal of the 200-Moving Average might have taken place due to the bearish breakout witnessed on 11th June. A negative pullback from a descending triangle resulted in Bitcoin SV dropping below $184 and ever since the asset has remained under the Fibonacci retracement point of 0.786.
From the above chart, a possible re-test at $155 could also be in the cards for Bitcoin SV, but since support at $164 is strong, the asset might be able to sustain above the range.
Relative Strength Index or RSI failed to display any buying momentum as selling pressure continued to increase in the charts.
Conclusion:
Bitcoin SV will possibly display further sideways movement and remain between the range of $218 and $164 for the near future. Possible incline movement to $214 may surface by Mid-July.