
Disclaimer: The findings of the following analysis attempt to foresee BSV’s movements up to the last week of July
Over the past two months, Bitcoin SV has been struggling to touch the price range it was trading within in early-2020. Unfortunately, Bitcoin SV’s price trends didn’t seem any likely to note a reversal either, at the time of writing. While the price had gone above its 12 March price point, BSV’s price does have the habit of retracing itself quite often.
At press time, Bitcoin SV was being traded at $154.50 and it had a market cap of $2.8 billion. Over the past 24 hours, BSV’s price had recorded a drop of 1.3 percent, having registered a 24-hour trading volume of $849 million.
Bitcoin SV 1-day chart
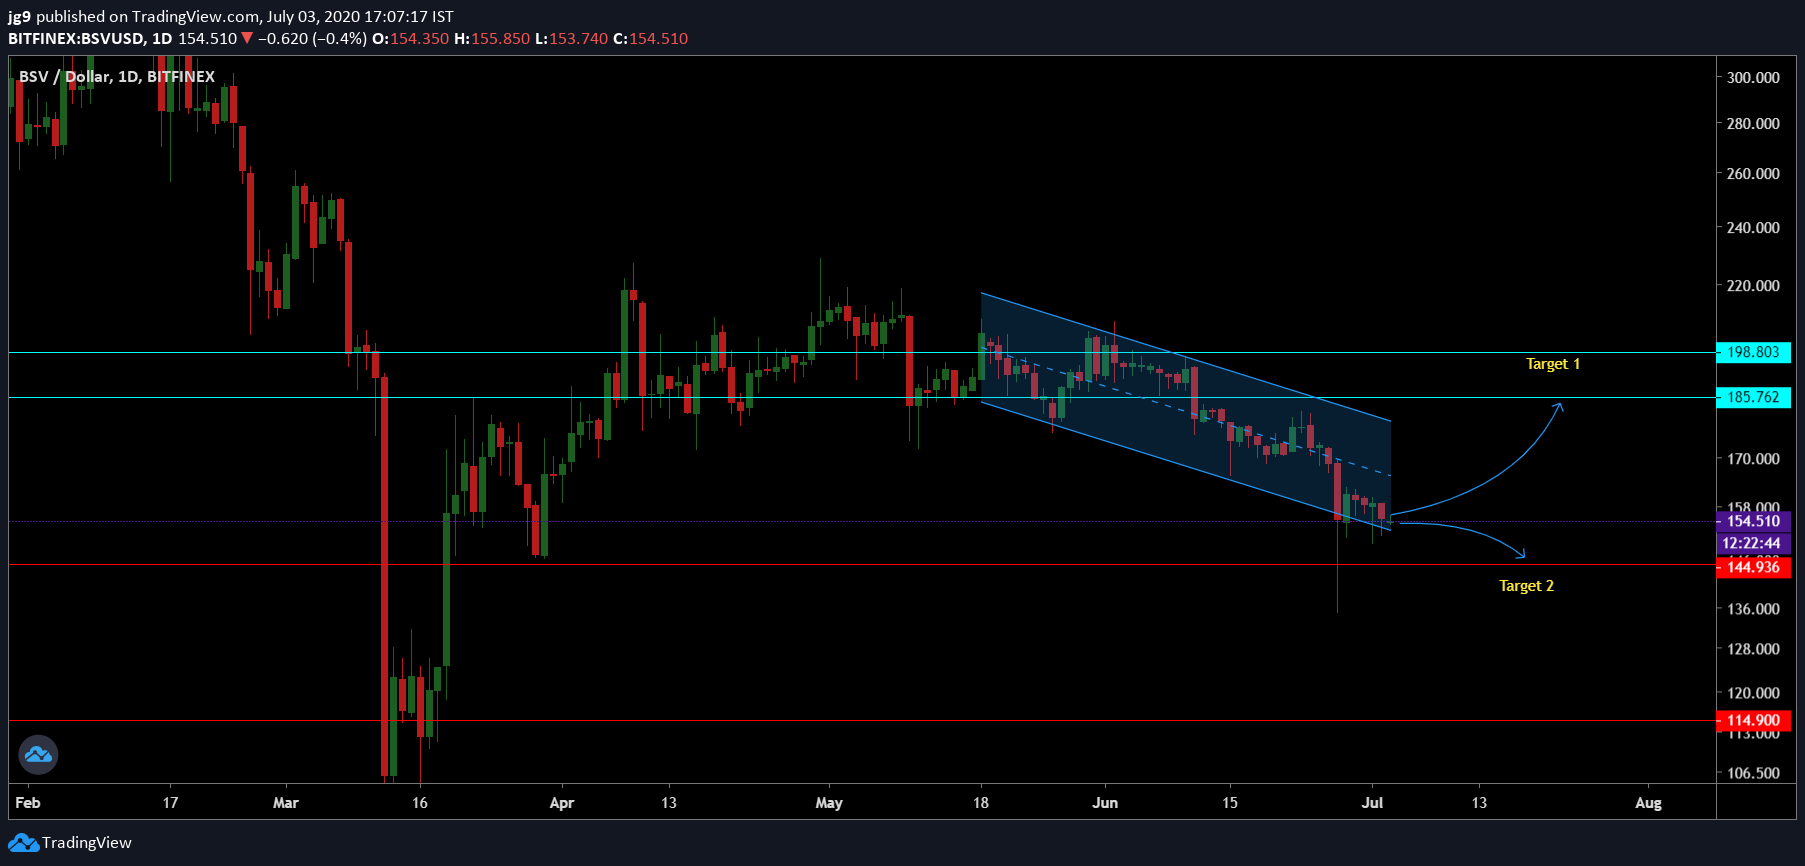
Source: BSV/USD, TradingView
When Bitcoin SV’s 1-day chart was observed, it was found that BSV’s price was continuing within a descending channel formation. Since the price has been stuck within the channel for a little less than two months, a breakout is likely to happen soon. For BSV, when the price breaks out of the formation, the price is likely to head northward and come in contact with its immediate resistance.
At press time, for Bitcoin SV, there was a support level nearby at $144. The next resistance for the coin was at $185, with another strong resistance at $198. If the support fails to hold the price, then BSV’s trading price may even drop to the $114-range. When the price does break out of the formation, it will likely head towards Target 1, following which, it might test the resistance towards the end of July. However, in the coming week, this bearish trend is likely to continue and the price will move towards the $144 mark.
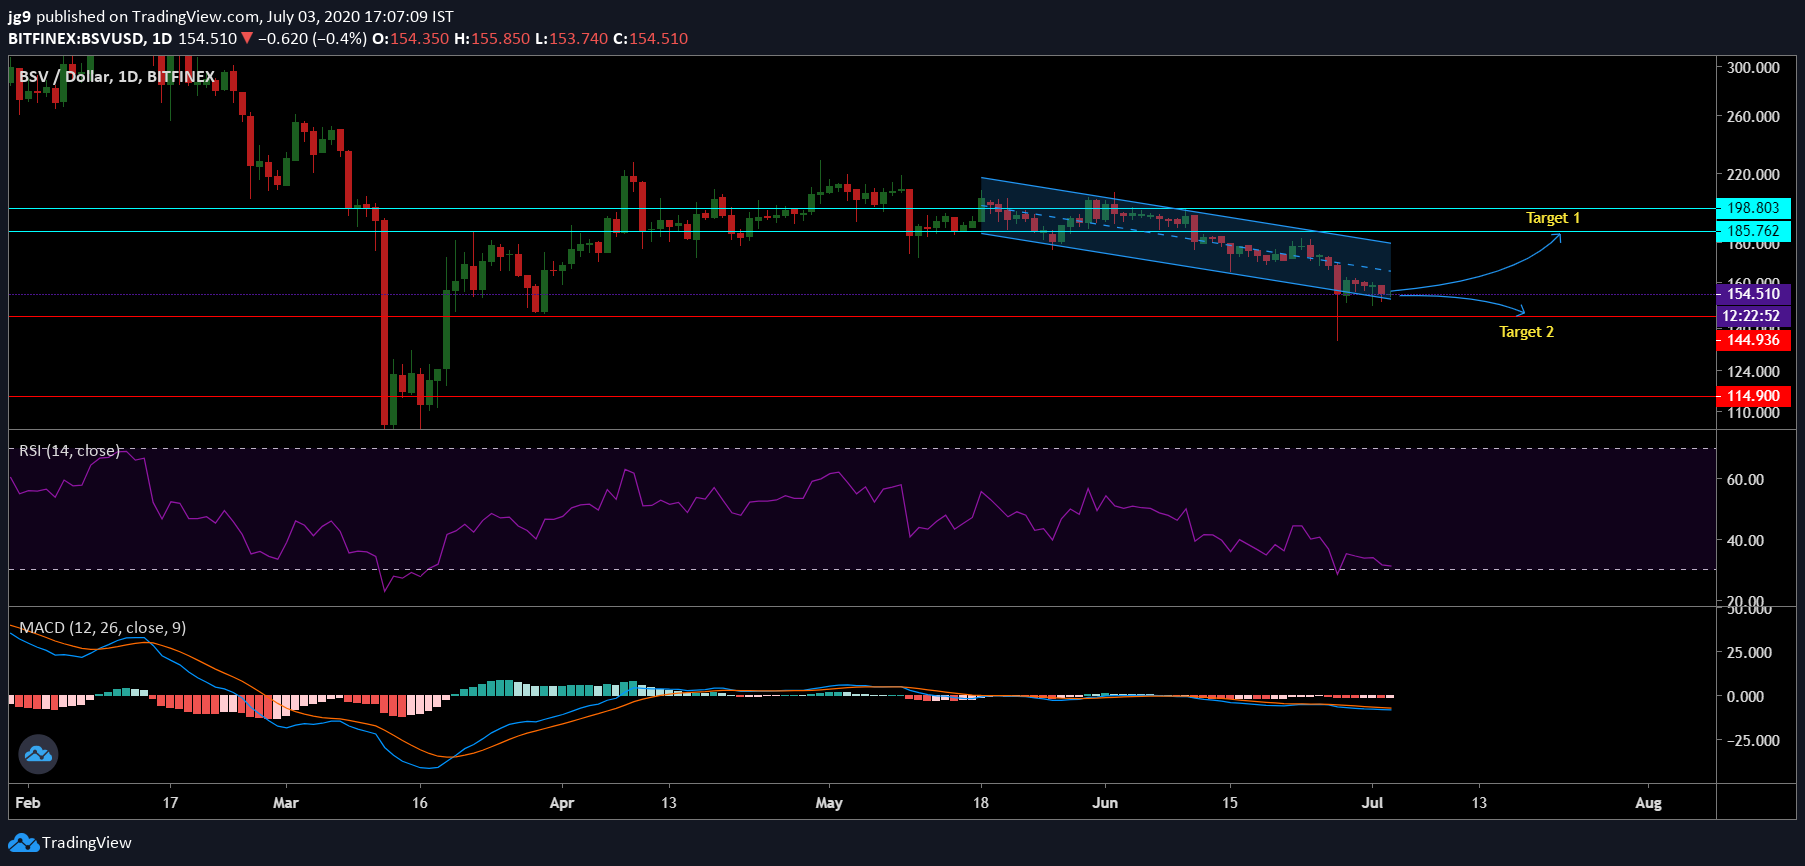
Source: BSV/USD, TradingView
Interestingly, the MACD indicator had undergone a bearish crossover, with the Signal line going past the MACD line over a week ago. Further, the RSI indicator was heading towards the oversold zone on the charts.
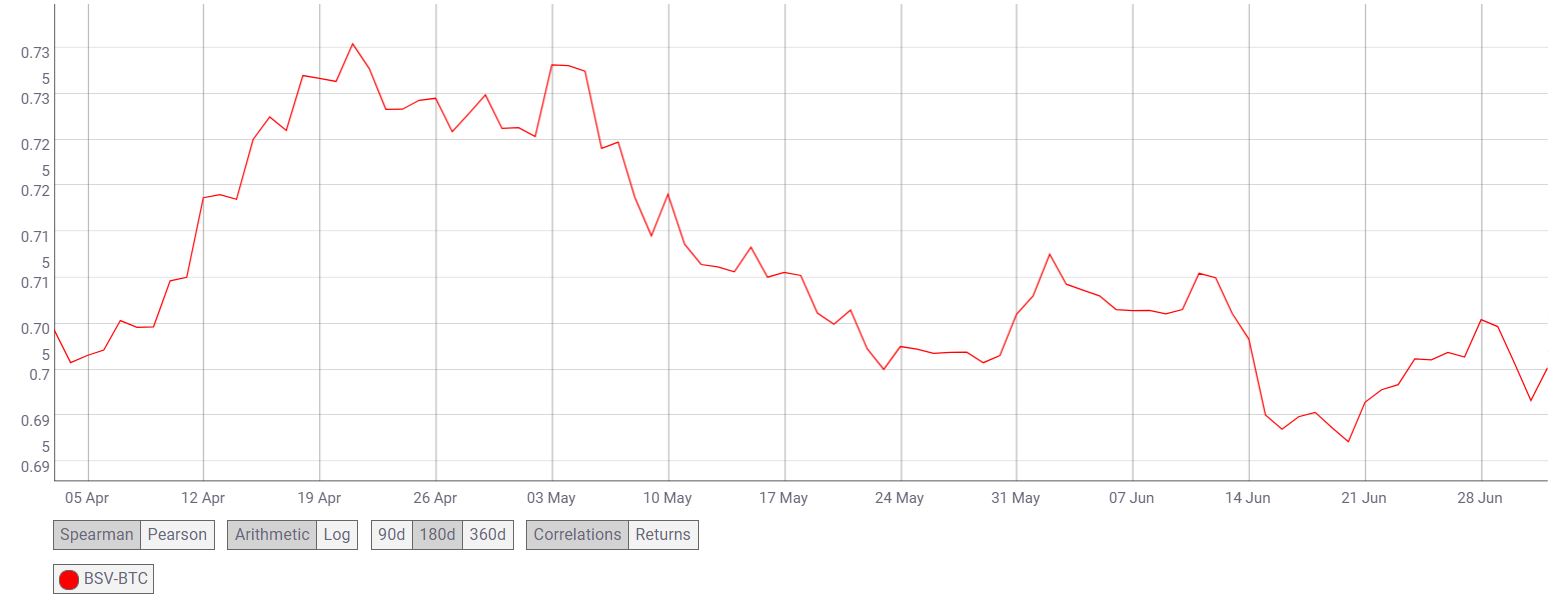
Source: CoinMetrics
Bitcoin SV’s correlation with the world’s largest cryptocurrency, Bitcoin, continued to lose momentum. However, the fall isn’t dramatic yet, with the correlation dropping from 0.73 to 0.70 over the course of 3 months.
Conclusion
Bitcoin SV has been in a descending channel for close to two months now and the price breakout is likely to happen in a week’s time. BSV’s price will, in all likelihood, dip further to $144 over the next week, while staying within the descending channel formation. However, once the price breakout occurs it is likely to rise towards the resistance at $185 by the end of July.