Crypto News
Bitcoin SV, Dash, BitTorrent Price Analysis: 28 October

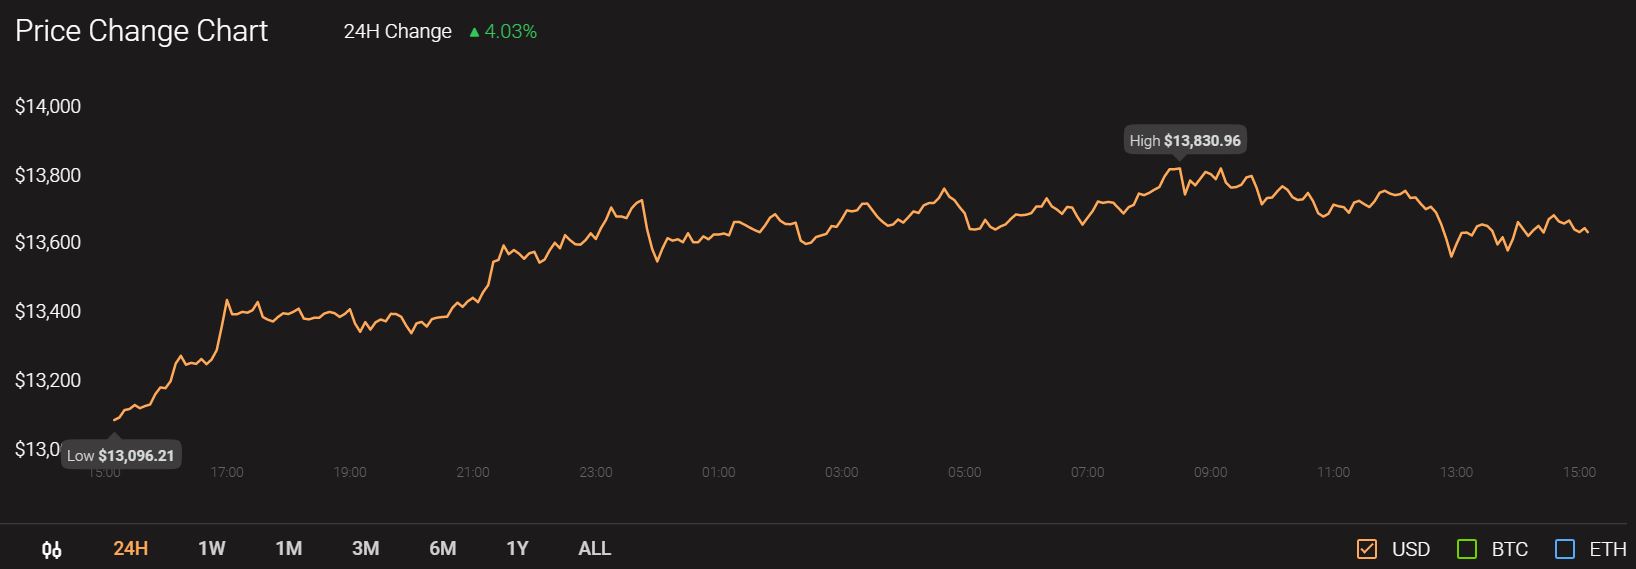
Bitcoin SV made a strong move upward alongside Bitcoin and exhibited a bullish divergence that could see BSV break beyond a level of resistance. At press time Bitcoin was being traded at $13,643 with a trading volume of $291.9 billion.

Source: CoinStats
Dash saw a steady stream of selling volume on the asset and registered losses over the past week. BitTorrent closed beneath an ascending trendline and lost a level of support at the same time, reinforcing the bearish pressure on the asset.
Bitcoin SV [BSV]

Source: BSV/USDT on TradingView
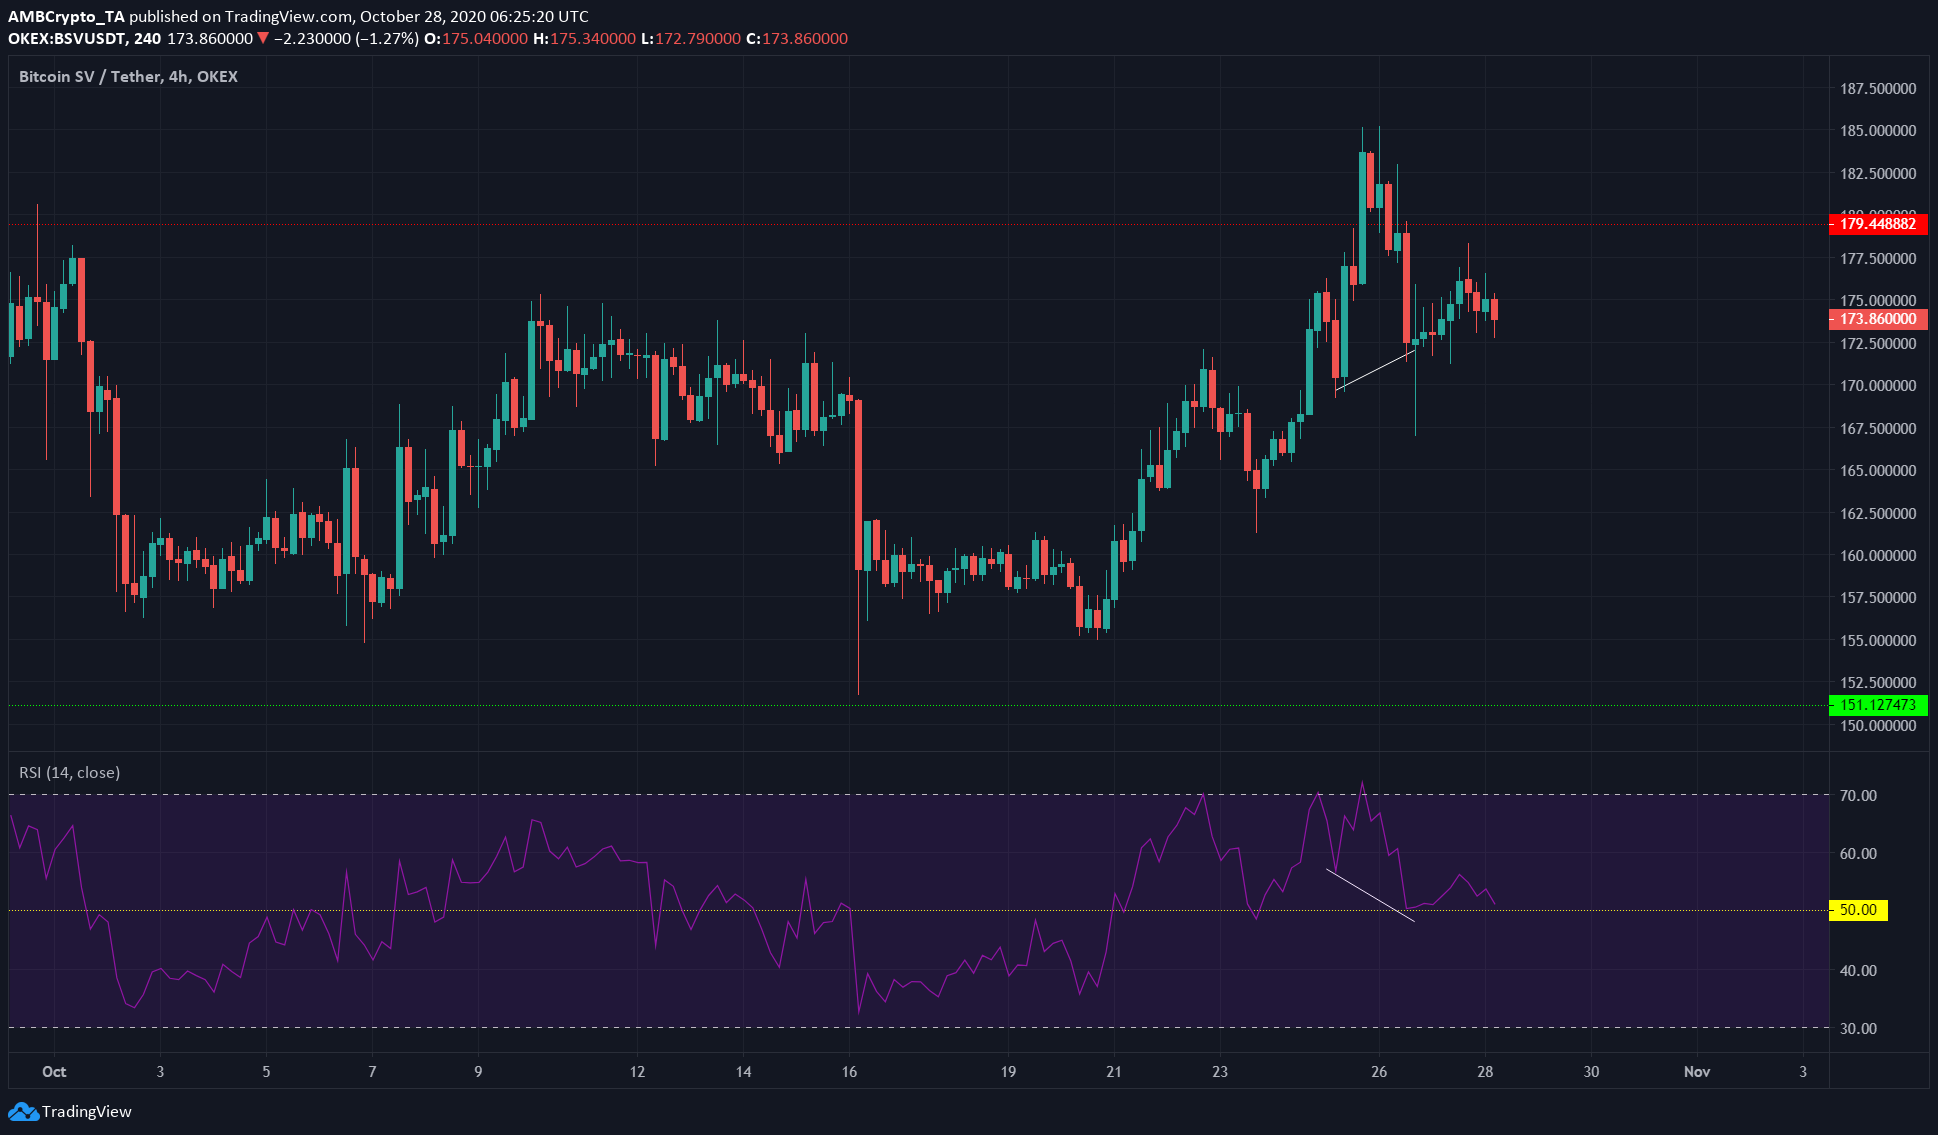
Bitcoin SV was in a strong uptrend. It has traded within the range between $154 and $178 in the past month, and the price can possibly be rejected at the resistance level of $179.5.
However, the RSI stayed above 50 and indicated a bullish scenario for the asset. Unless BSV suffers another blow that drives the price downward, there is a good chance that resistance can be breached.
A hidden bullish divergence (white) was also spotted, a signal that indicated the continuation of the previous trend. In this case, this divergence signaled that the previous uptrend would continue.
Dash [DASH]
Source: DASH/USDT on TradingView
DASH surged to $77 last week but was strongly rejected. It attempted to breach the resistance once more but did not have the backing of buyers.
In fact, since last week’s surge, buying volume has been falling, as shown by the OBV. This meant that DASH’s subsequent attempt was unlikely to make any headway, and so it played out.
Since then OBV has been trending lower, and the price was likely to follow. The $69.8 level could be lost in the coming days and selling pressure could see DASH test $65 as support.
BitTorrent [BTT]
SourcE: BTT/USDT on TradingView
BitTorrent was in a steady uptrend (white), but a close below the ascending trendline, combined with the inability to defend a flipped level of support at $0.000336 meant that BTT was poised to move sideways or downward.
Downward the price went, registering steady losses. The Directional Movement Index showed a strong downtrend for the asset, as the ADX (yellow) moved above 20 and the -DI (pink) indicated the bearish direction of the trend.

