Bitcoin short-term price analysis: June 28

Bitcoin dipped down to $8,830 yesterday, however, it closed only 1.63% below from where it opened. While this is a relatively small move, the price seems to have conformed to a downtrend due to consecutive lower lows and highs.
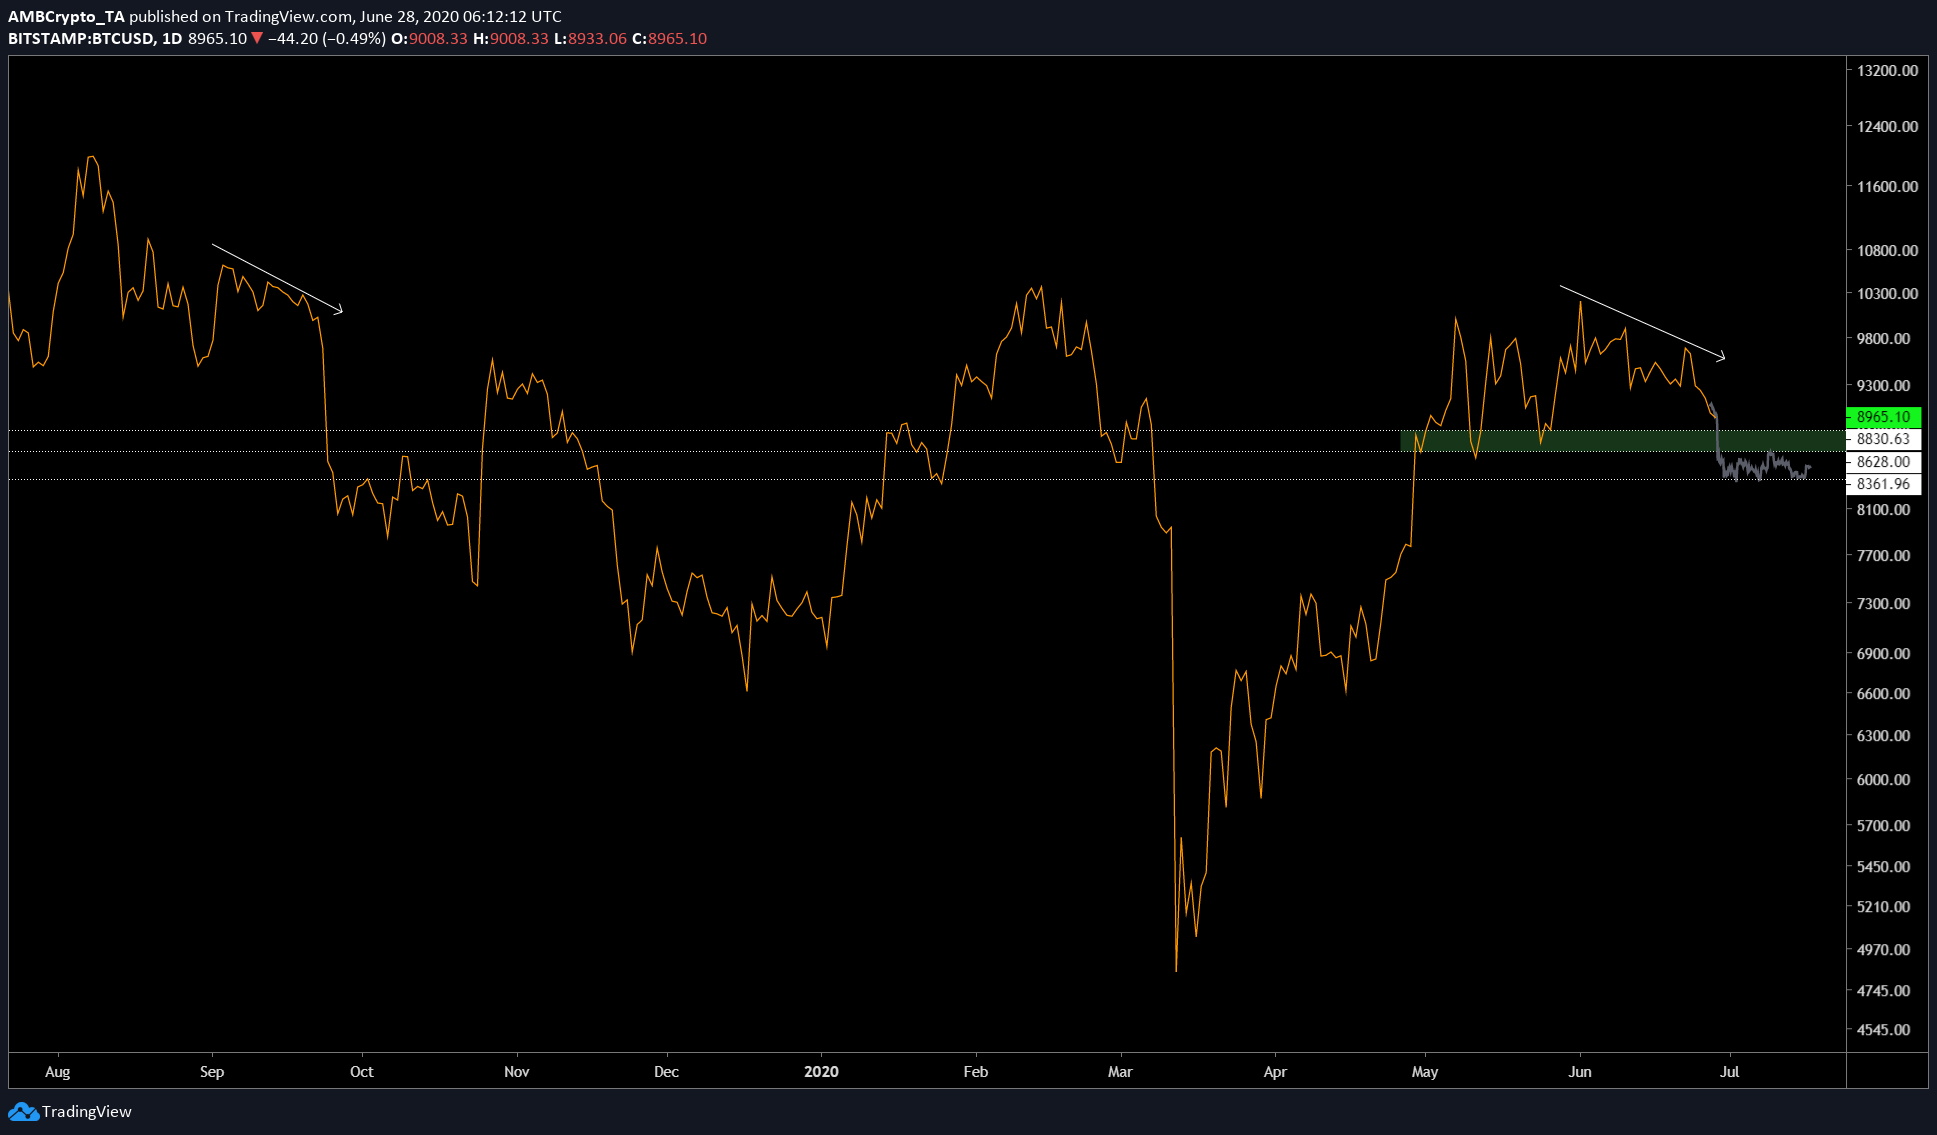
To understand what’s happening on the lower time frame and why Bitcoin is heading down, it is necessary to take a look at the big picture. Attached below is the one-day chart for Bitcoin, which shows the formation of a pattern similar to the one seen in September 2019.

BTCUSD TradingView
Although fractals look similar, it doesn’t necessitate a drop of similar extent. The drop that BTC is yet to experience [based on the fractal formation] will depend on the current support and resistance levels. As seen above, these support levels range from $8,830 to $8,630, this is where the initial drop will be absorbed and it is a critical level that can prevent further drop.
However, breaching this level would leave the price exposed to the level at $8,360. As the price hits the $8,360, more sideways movement can be expected, very similar to what happened after the price dropped in September 2019.
Bitcoin four-hour chart
BTCUSD TradingView
From the above chart, it can be seen that the price is forming a descending triangle, which has an inherent bearish bias. The breakout from this pattern can be expected to head down, further validating the downtrend. The price has already tested $8,830 and bounced higher, which shows promise, at least for now.
With BTC closing below 50-DMA [yellow], it further strengthens the above theory. What’s more interesting is the final target of $8,360 perfectly converging with 200 DMA [purple].
Although it was mentioned that the bull run would start soon, there is still enough space and time for the price to dip down to $8,100 or even $8,300.


