
Bitcoin might be trending on Twitter, but on its charts, it’s more of the same. Since hitting the $9,000 mark over two months ago, and despite numerous seismic events, including the halving, a massive derivatives expiry, and a Twitter hack, Bitcoin is still trading in the same range.
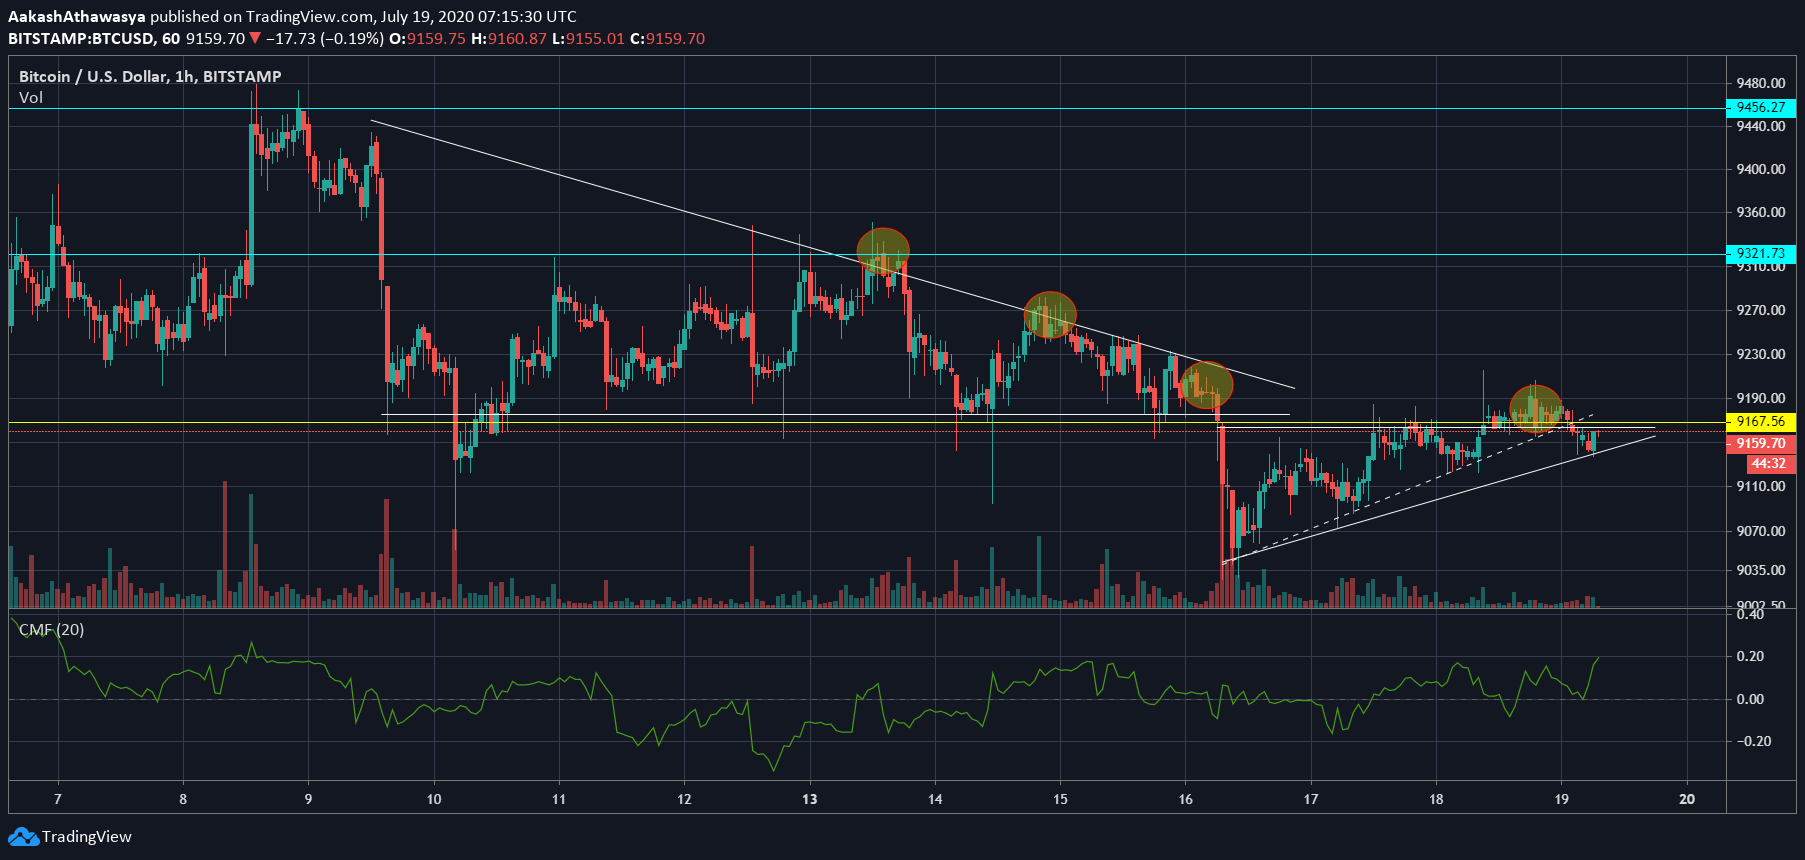
Looking at the short-term chart of the king coin, there is reason for concern, but not more so than has already been in this period of sideways trading. Bitcoin, since the beginning of the second week of July, has been trending downwards, forming consistent lower highs. Its journey can be put into one large falling wedge, or, on the contrary, a descending triangle followed by an ascending triangle.
The first triangle persisted from 10 to 16 July as the price fell from $9,400 to $9,150, going past the resistance-flipped support at $9,320. The demarcation between the first and the triangle is the drop from $9,200 to $9,020, which occurred within the span of 5 hours on the eve of 17 July. The ascending triangle saw higher lows, as opposed to the previous triangle, and is still on the verge of a breakout.
Source: BTCUSD via Trading View
Despite the steady growth of the ascending triangle, the price has not moved past its succession of lower highs. As can be seen by the ellipses in the chart, lower highs are placed at $9,320, $9,270, $9,200 and $9,170. Bitcoin, in the past 24-hours, broke the $9,170 resistance level but fell below soon after as it did not have enough volume to allow for a breakout.
Chaikin Money Flow indicator is currently at 0.11, but is steadily rising. This is a positive sign for the coin’s price as more investors are injecting money into the coin, but volume is still on the lower side. Coinmarketcap puts the total 24-hour Bitcoin trading volume at $12.3 billion, whereas on July 15, the volume stood at $17.5 billion.
Going by chart patterns and triangle, opposite to the downwards breakout of the descending triangle, the follow-up to an ascending triangle is a breakout upwards. Even if the price breaks out upwards, supported by money inflow and volume, it should trade within the zone of $9,160 to $9,300, with a breakout over the same unlikely.