Bitcoin Cash, the hardfork of Bitcoin, is in the category of altcoins that have sunk post the events of ‘Black Thursday.’ Following the market collapse in March, some altcoins surged even higher than their Q1 2020 prices, others failed to recover. Bitcoin Cash, evidently, is in the latter category.
Looking at the long-term price of the altcoin, it is quite apparent, that BCH’s recovery was short-lived. After falling to a low of $155 in March, the price immediately picked up to $265, a massive 76 percent price increase, less than 20 days after the price crash. However, this would be the highest price point for Bitcoin Cash for the next four months.
Fast forward to July 2020, and Bitcoin Cash has not managed to move past resistance level of $265, in fact, its press time price of $223 is 15 percent below the level. Here, it is important to note that BCH did not collapse in one fell swoop, instead, this drop was in phases of one-month each.
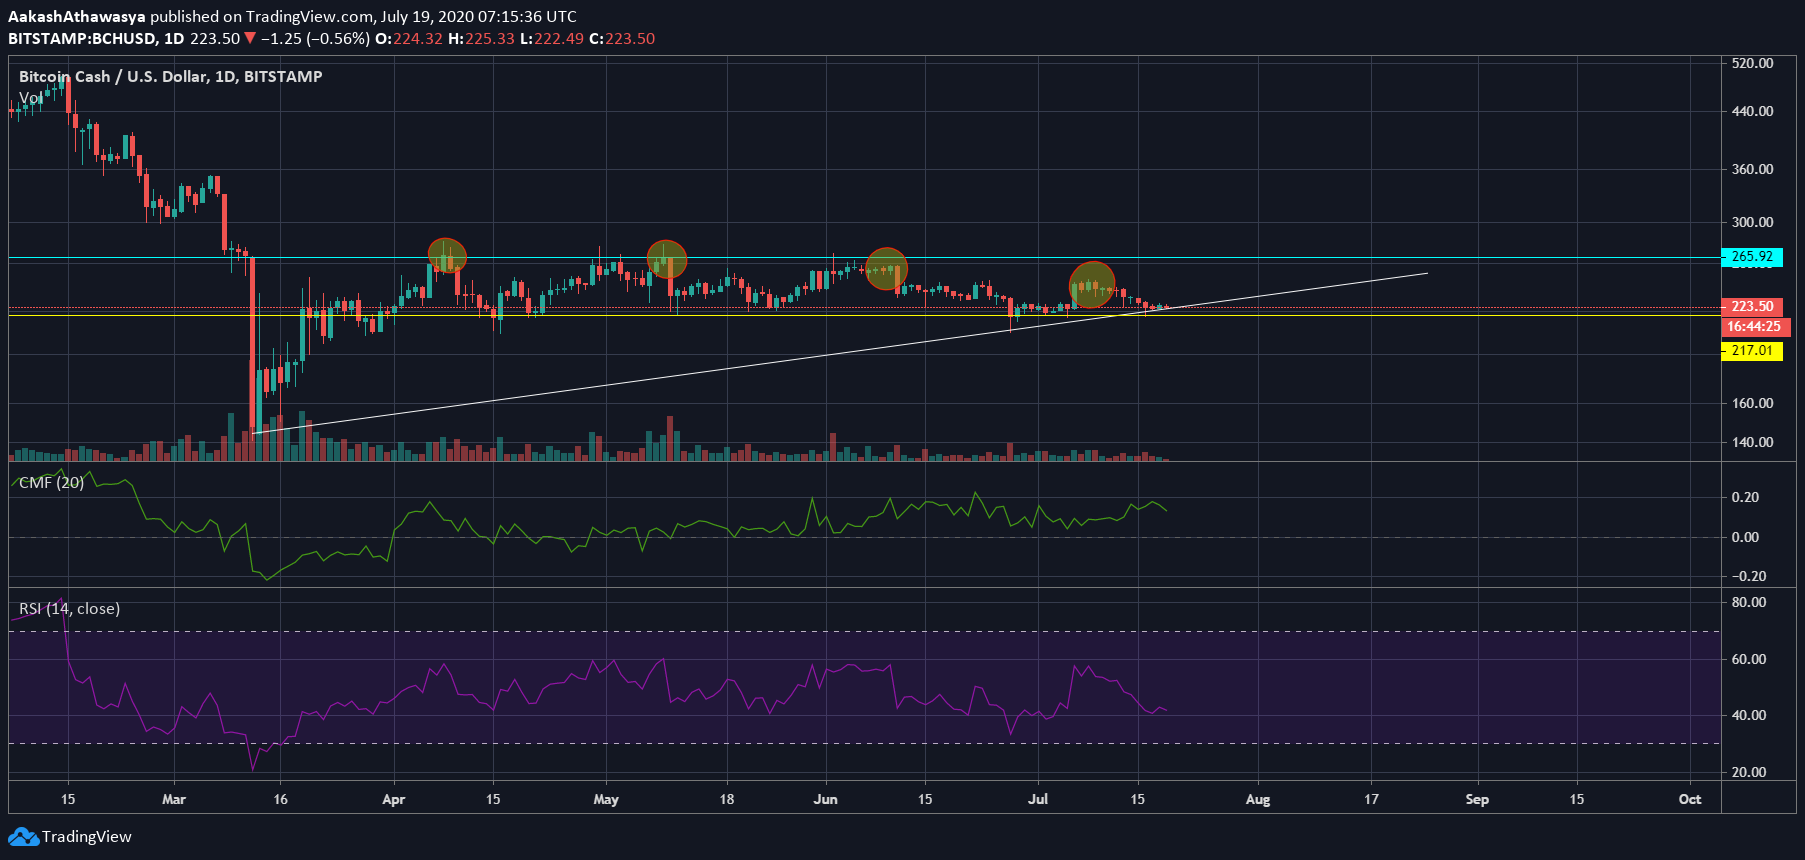
Source: BCHUSD via Trading View
The first phase from mid-April to mid-June saw the price drop mildly from $260 to $250, the second from mid-May to mid-June saw the price fall to as low as $220 before recovering no higher than $250, and the final phase from mid-June to mid-July yet another drop below $220, before a recovery no higher than $240.
As can be seen from the chart at the price rebounding back and forth, Bitcoin Cash, with every passing month, has been creating lower highs and [marginally albeit] lower lows. This consistent tug on the lower end of the candlestick is pushing its price down, and it’s accompanied by decreasing volume.
Relative Strength Index for the altcoin is currently at 42.39, which is within a healthy range. However, it should be noted that since April, BCH’s RSI has been locked between 40 and 60, with the only breakout occurring in late-June when the price dropped below $220 for the first time since March.
As things stand, BCH’s current price is dangerously close to the lower support at $217, and the lower end of the ascending triangle. Given the decreasing volume and investor confidence, a drop below is likely. However, since there is no short-term support on the lower end, traders might be averse to speculate on the price of Bitcoin Cash, as it could go far lower than $217. On the upper end, the trading range is quite broad between $220 and $250.