
The price of Bitcoin fell to $6,500 range on December 18, soon thereafter, the price saw a spontaneous rise to $7,400, a 15% pump in 10 hours. With longs hitting an all-time high on Bitfinex, this unexpected surge in BTC’s price saw huge liquidations of Bitcoin longs on BitMEX.
Hourly Chart
For now, Bitcoin’s price moves comfortably sideways forming a pattern that is indicative of a bullish breakout in the near future. Bouncing within the pattern, BTC has dipped below the 50-hour MA [blue], which looks like a brief dip. In case of bearish pressure, a successful dip into the 50-hour MA [pink], the 100-hour MA will support the price just below the $7,000-range.

Source: BTC/USD TradingView
The MACD and the RSI for this chart are both receding, indicating an onslaught on bearish pressure, however, the OBV indicator is still moving sideways after hitting a peak of $185k, indicating that the bulls have equal pressure as the bears.

Source: BTC/USD TradingView
The breakout, at press time, could go either way, however, ascending triangles usually have a bullish bias. Assuming a bullish break, the next stop for Bitcoin would be the prior peak of $7,400, which is an area of high resistance, at least until, $7,700.
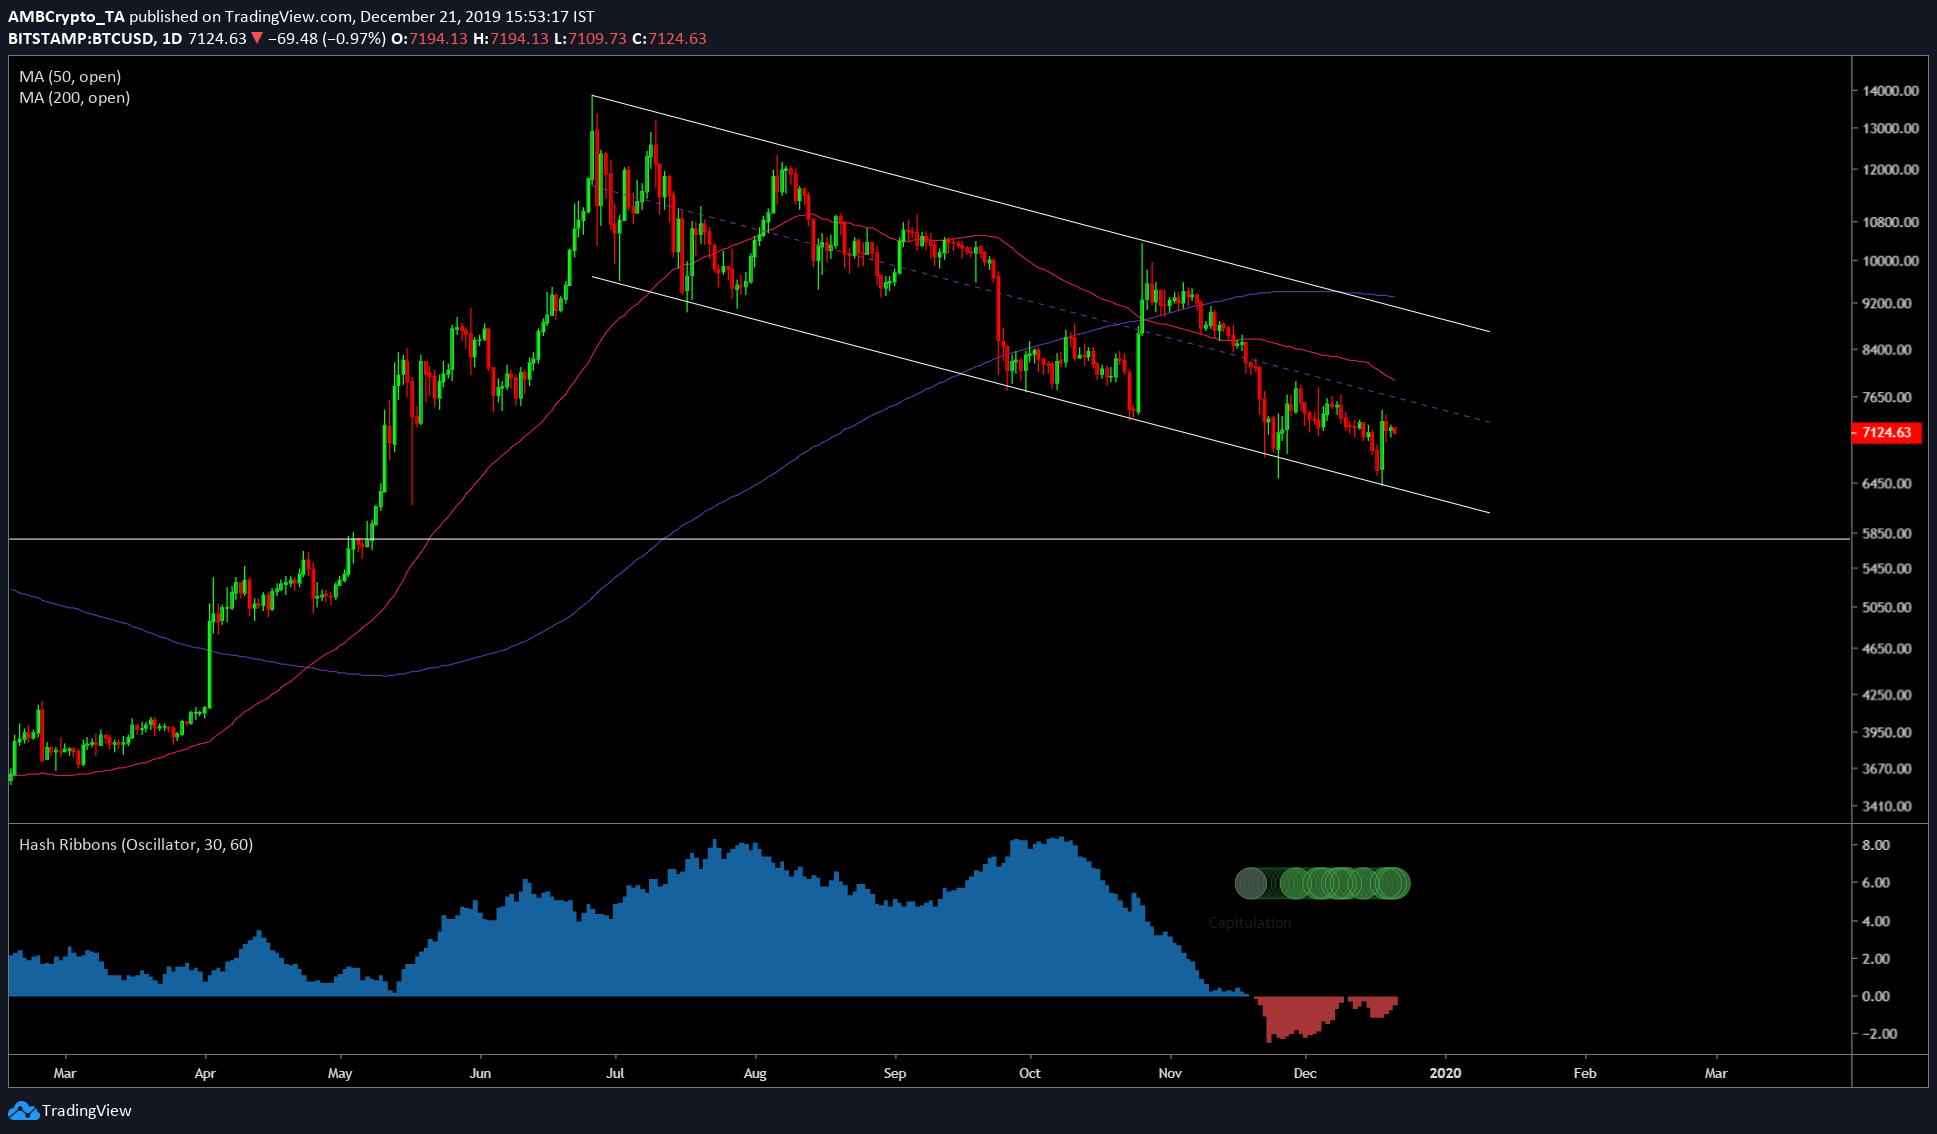
Daily Chart
Things start to look a little different on the daily chart as the recent dip down to the $6,500 caused the 50 moving average to dip further below causing the already existing death cross chasm to widen a little more, further bolstering the bearishness in the market.
Source: BTC/USD TradingView
Moreover, BTC on the daily time frame is stuck between a mixture of a descending channel and a falling wedge, both of which are bullish patterns. Supporting this is the bullish OBV indicator. However, both MACD and the RSI indicate the bearishness to come.

Source: BTC/USD TradingView
Bitcoin’s final confirmation for a bearish outlook in the long term is the hash ribbons, which are indicative of the miner capitulation. Confirming this is the Bitcoin dominance, which has hit a ceiling yet again at 68.1%.
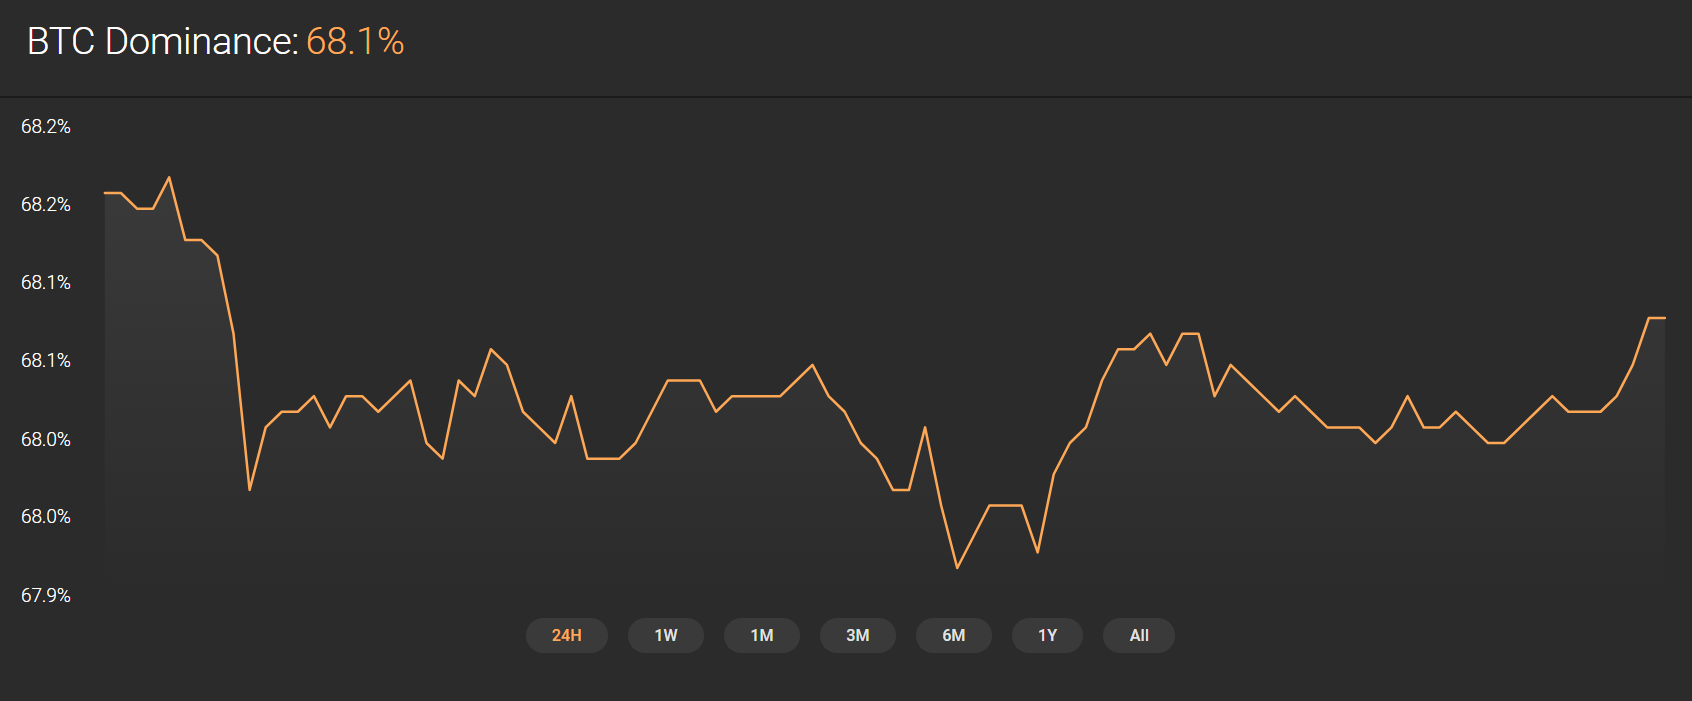
Source: Coinstats
Conclusion
Short-term future for Bitcoin indicated a possible pump up to $7,400 in the next 24-hours, further bullish momentum could push the price to $7,700.
Long-term future for Bitcoin is still uncertain. There is a possibility that Bitcoin might undergo a short-term dump back to the $6,500 zone and push as high as $8,500 hitting the upper band of the descending channel.


![Real-world assets [RWA]: How to invest in Gold & Real Estate on-chain](https://eng.ambcrypto.com/wp-content/uploads/2026/02/Samyukhtha-5-400x240.webp)