
Bitcoin was faced with multiple pieces of news that, even a year or two ago would have forced massive sell-offs. The BitMEX case, uncertainty in the markets due to the US elections, news of stimulus package being postponed to November, the US President contracting coronavirus, and even the general economic outlook in a world challenged by a global pandemic. The asset shrugged it all of and made gains, and this was in just the past month. News of institutional interest from Square and MicroStrategy certainly helped. A rising Bitcoin also promised to pull altcoins with it, based on the dropping Bitcoin Dominance.
Bitcoin [BTC]
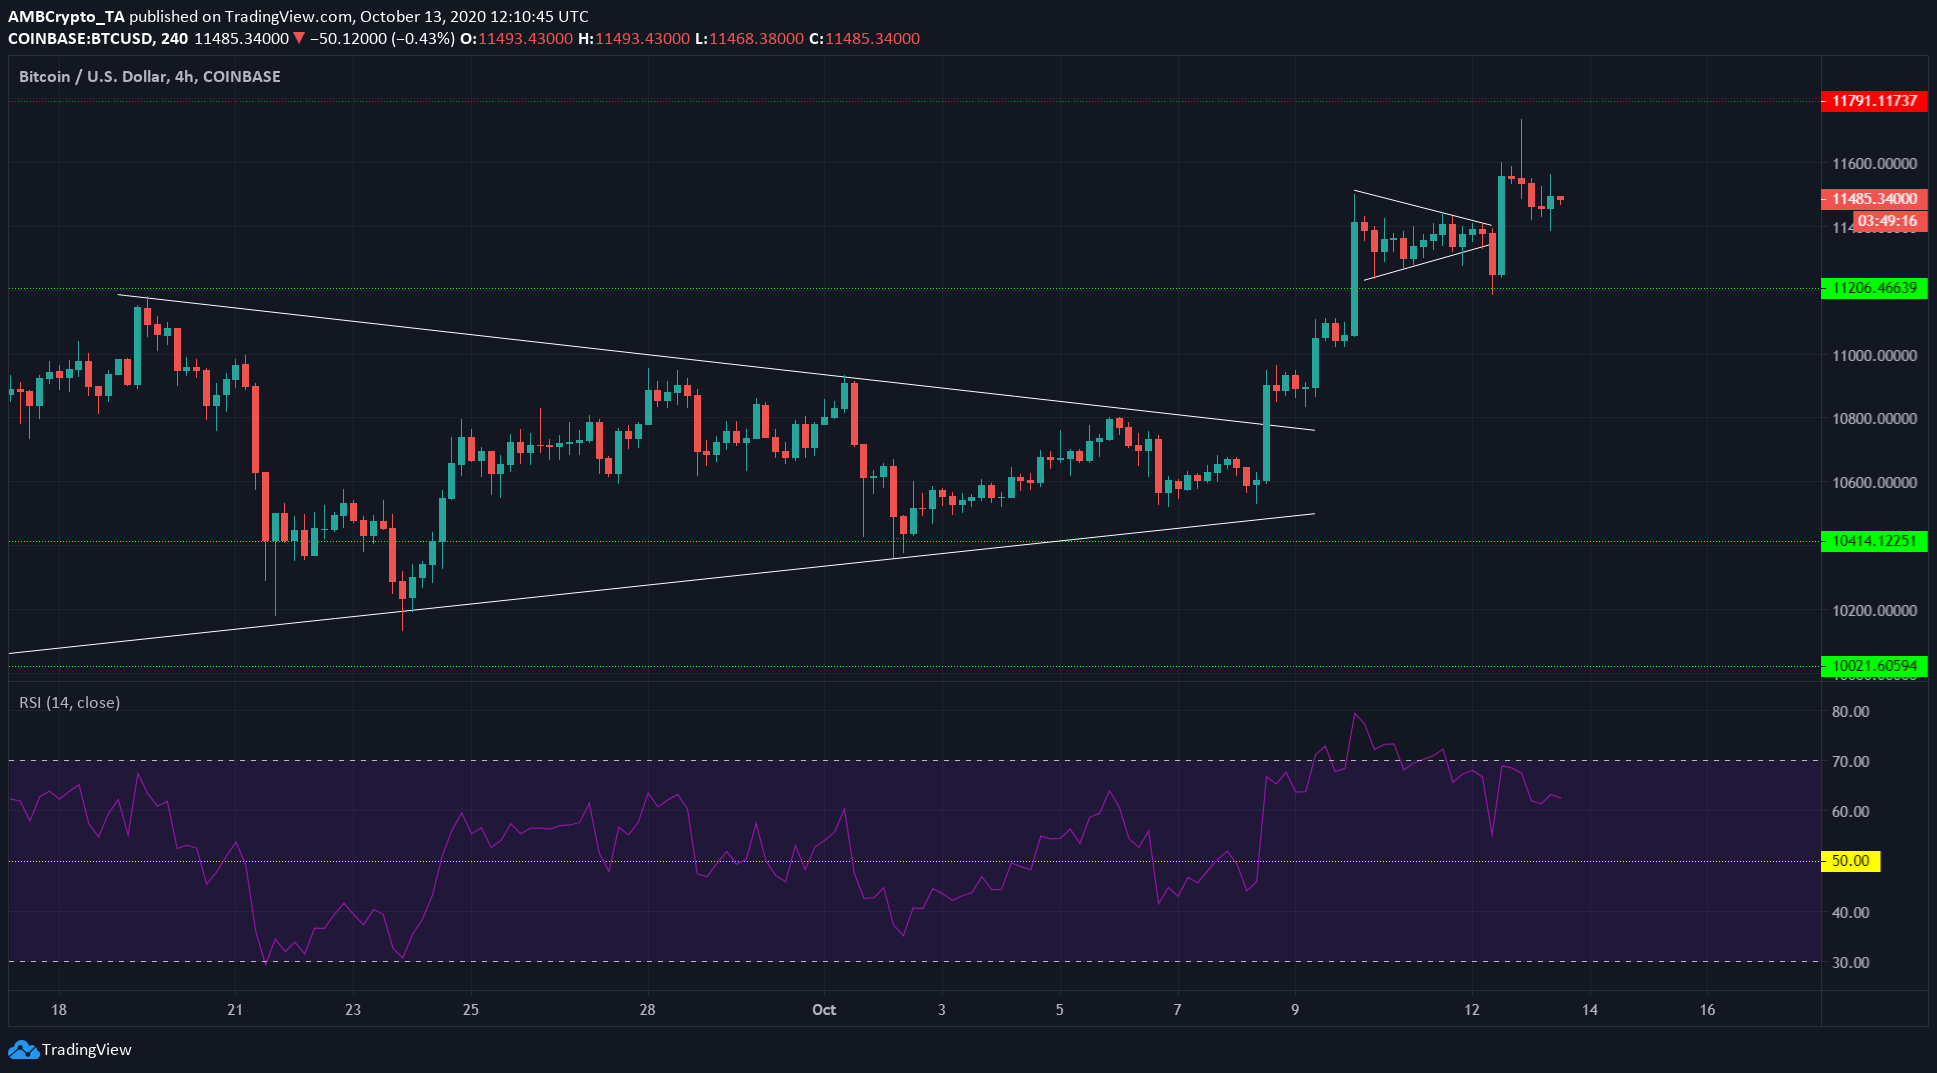
Source: BTC/USD on TradingView
Bitcoin breached an important level at $11,200 and faced $11,800 as the next level of resistance. It had formed a symmetrical triangle in the past couple of weeks and BTC broke out to the upside to reach $11,450. Over the past few days, BTC appeared to be forming a similar symmetrical triangle.
Price broke out to the upside once more and it appeared likely that Bitcoin would attempt to breach $11,800 and $12,000 psychological resistance in the next few days.
However, there was a close beneath the pennant as well, in what was possibly a stop-loss hunting strategy.
IOTA
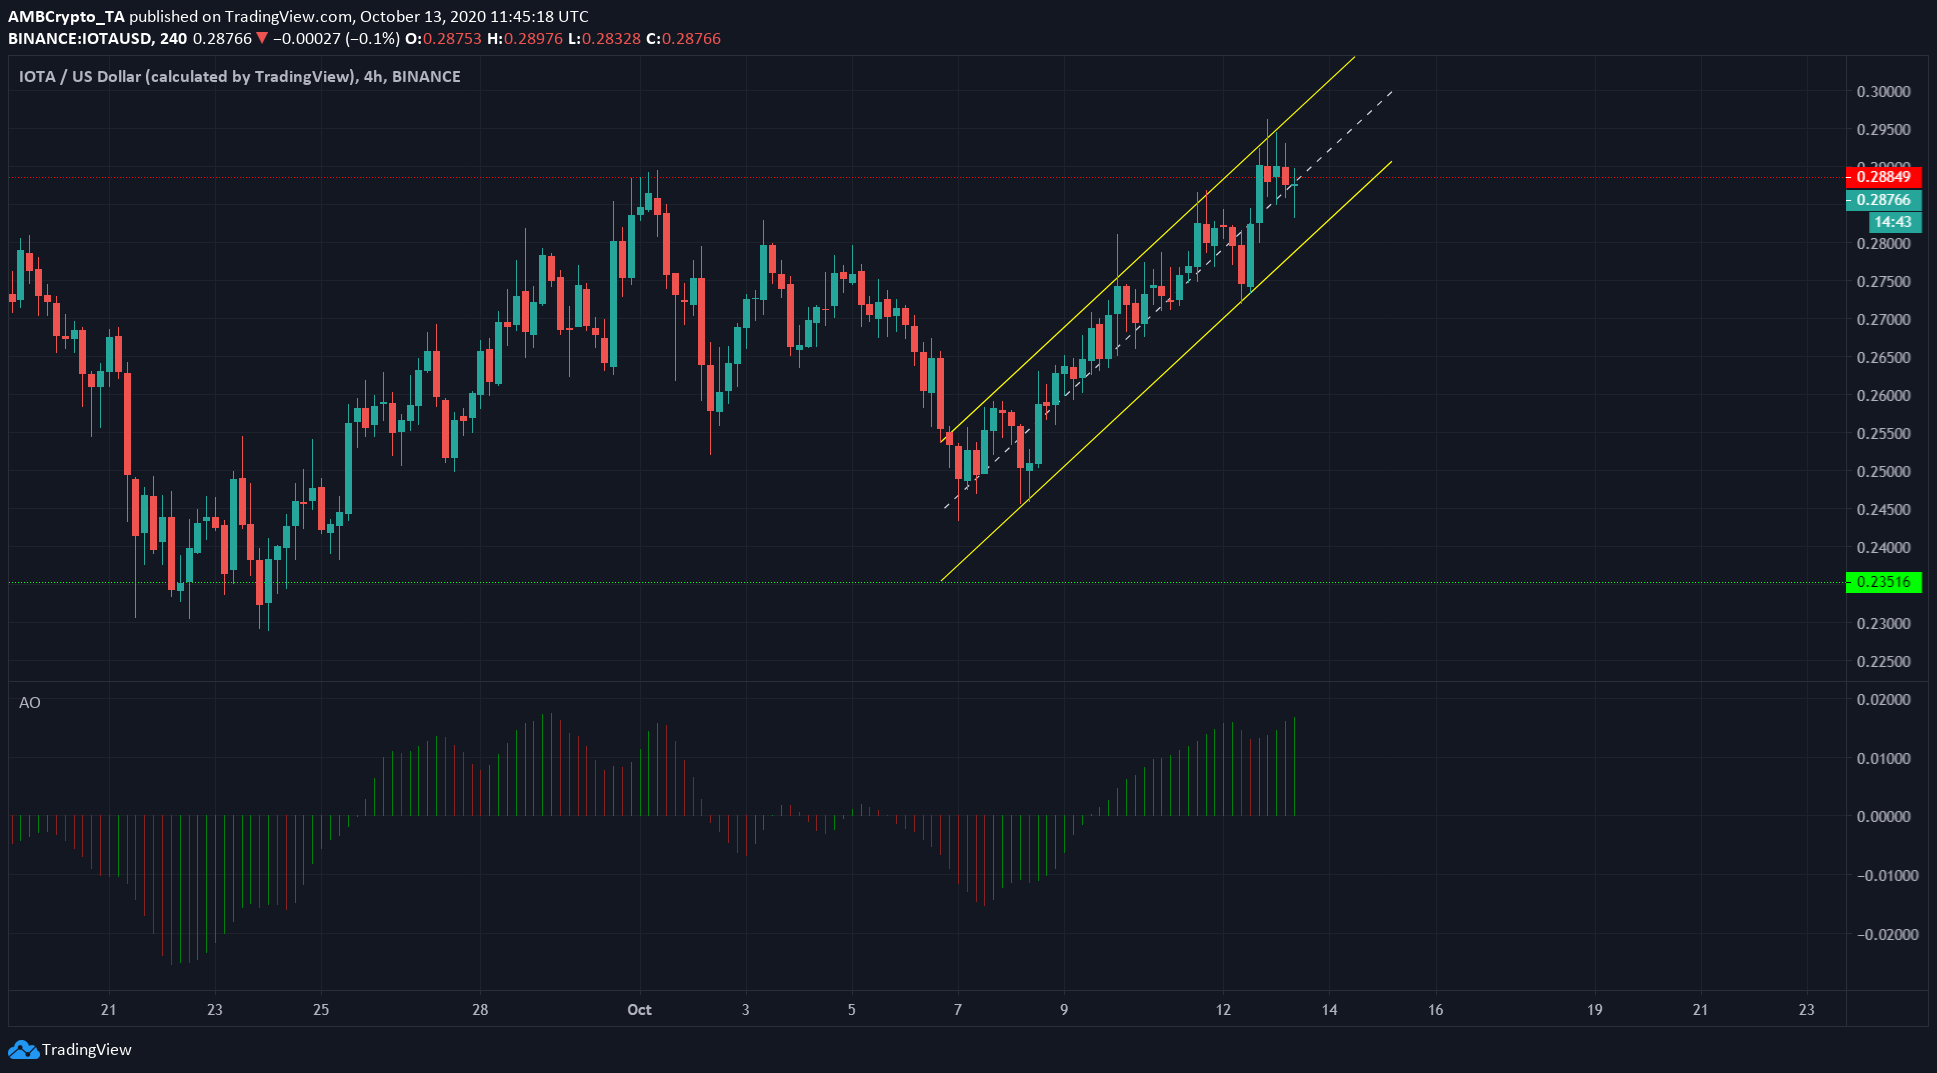
Source: IOTA/USD on TradingView
IOTA was moving within an ascending channel. At press time, the momentum was still going strong as the Awesome Oscillator registered green bars on the histogram.
With a level of resistance at $0.288 and right beside IOTA on the chart, a rejection could spark a brief downtrend while a close above resistance would signal the channel continuation in the coming hours.
The $0.288 region is important as it has been a level price has failed to close above since early September, and was the level where IOTA began its run to the yearly high of $0.448, previously touched in June 2019.
FTX Token [FTT]
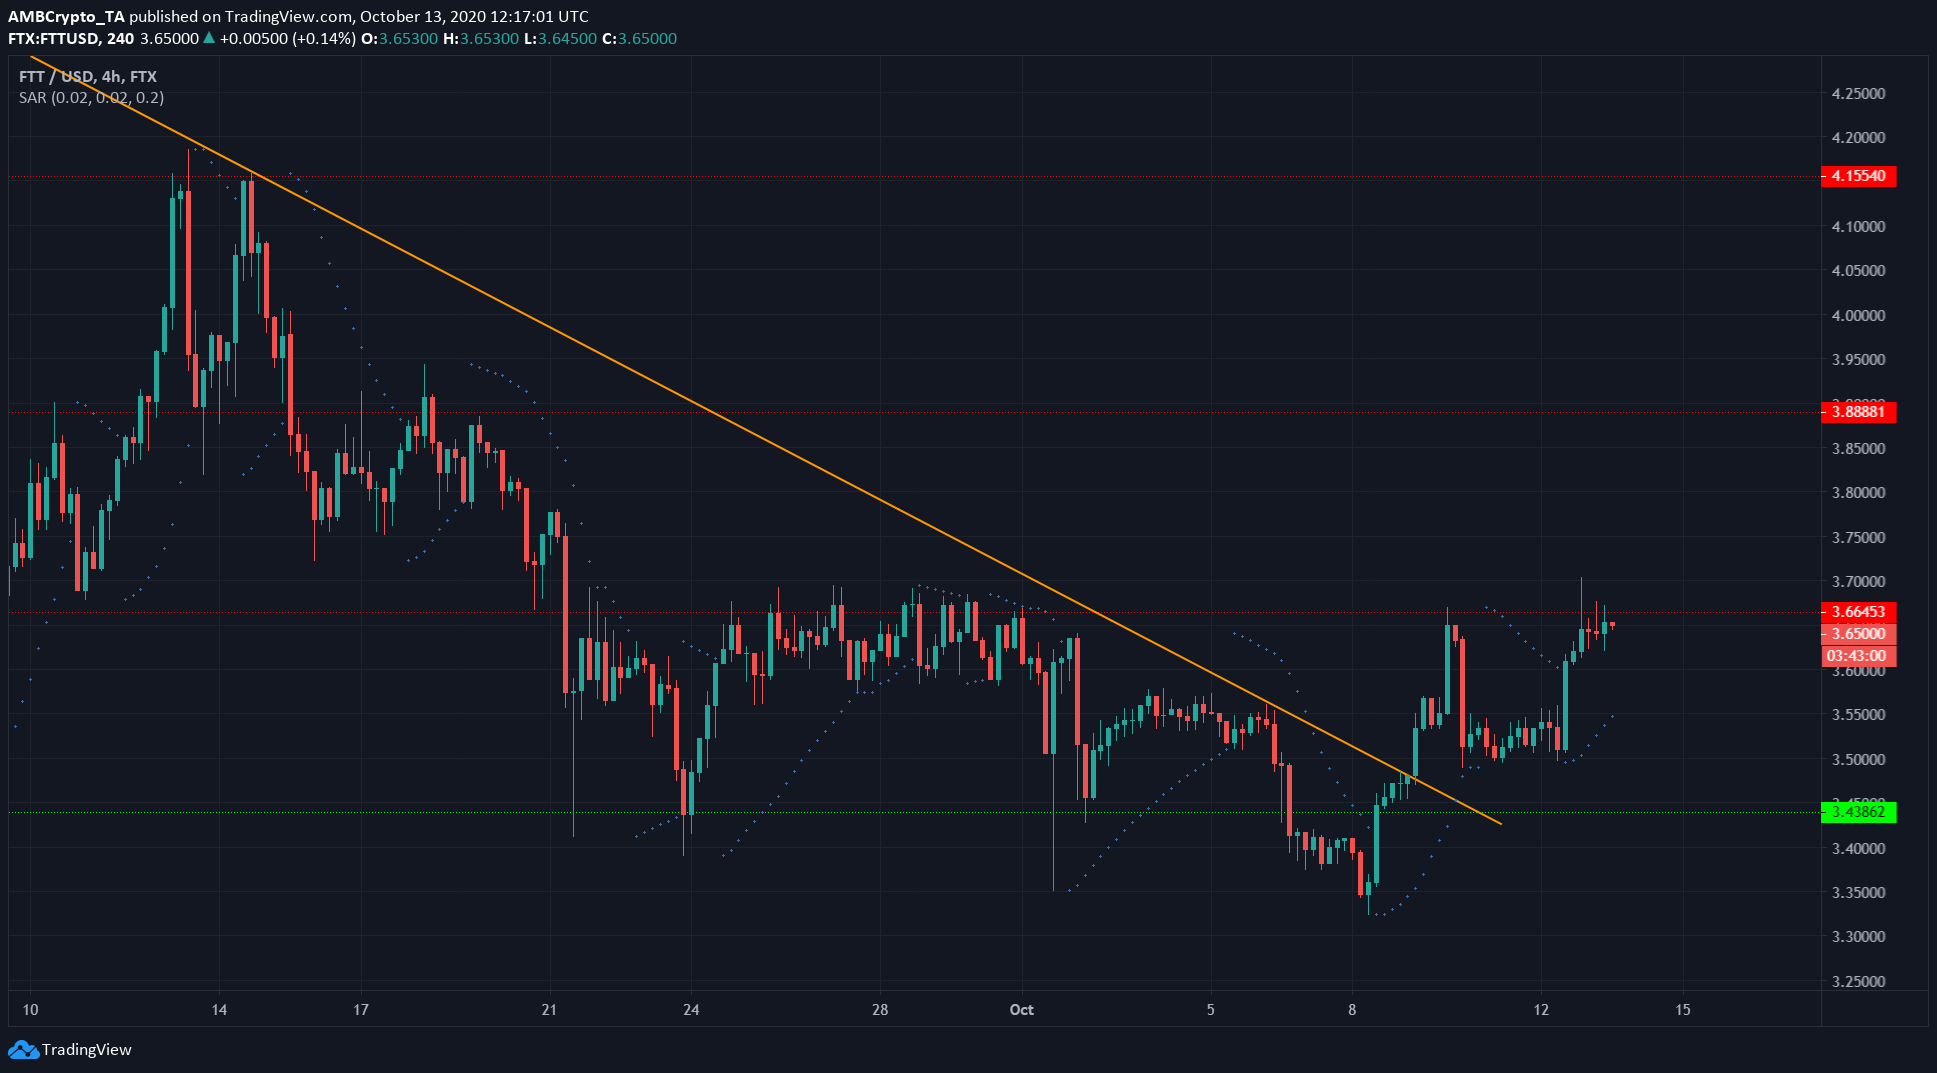
Source: FTT/USD on TradingView
FTT broke out of a downtrend (orange) beginning in early September. The breakout and test of $3.66 resistance were rejected on the first try, with the price being forced down to $3.5. However, the asset surged once more and at press time was trading beneath the same level of resistance.
The Parabolic SAR’s dots were beneath the price, indicating a buy signal and giving traders a possible stop-loss level.