
Back in May 2019, Bitcoin started at $4000 and came close to $14000 however the momentum could not be sustained and there was a subsequent fall in the price. There were signs of a bull run in the first half of 2020 in anticipation of the upcoming halving and the event acted as a potential catalyst. What was unexpected, however, was the crash of the world economy and a rapid surge in Bitcoin prices post-pandemic.
Bitcoin has made a recovery from the post halving drop and is showing signs of pushing higher. Comparing the price to May 2019, we see that there are several key differences like hash rate, Bitcoin’s market dominance, and the correlation between Bitcoin and Gold. These differences build a case for the bulls.
Bitcoin’s hash rate is at 119.39M TH/s, a year ago it was 72.14M TH/s. What’s more, Bitcoin has entered a cycle where price and hash rates are increasing simultaneously. Every halving cuts out less efficient miners and this halving has reduced it to the most efficient ones. This affects the price of Bitcoin on spot exchanges as mining activity has a knock-on effect on price. Miners do not find it profitable to sell their cryptocurrencies for lower prices, and they are the ones bringing liquidity to most spot exchanges.
This difference in prices pre and post halving is examined better in a market cycle. Bitcoin has two cycles and though they are not periodic to each other they correlate with each other. Bitcoin’s algorithm and hash rate affect the technical cycle, and various factors affect the pricing cycle.
To examine where Bitcoin is in the current cycle and count drops, refer to this Wall Street Cheat Sheet.

Source: Wall St. Cheat Sheet
It is not always easy to predict the position in a cycle, as two market cycles are never exactly the same shape and don’t occur in the same magnitude. So comparing price charts for the Bitcoin bull rally (2017) and now may not be the best way. Instead, counting drops against several factors in this market cycle is a better approach.
Counting the drops
The first drop in the market cycle pre-halving came on Feb 25, 2020, when the price was $9593. The price further dropped on March 16, 2020, hit $5238. Post halving the narrative changed and momentum in Bitcoin price increased further with smaller drops.

Source: Trading View
Additionally, it overlaps with the time when Grayscale raised $900 M for crypto products and these funds are locked in till October 1, 2020. This gives an assurance that another significant drop may not occur until later in 2020, however smaller drops are anticipated.
The current market cycle may seem bullish in one look, as the price drops are fewer and smaller in magnitude compared to post 2017 bull run, however, the google search trends for Bitcoin paint a different picture. Search volume for Bitcoin was highest in Q4 of 2017 and early 2018, however, it failed to hit that peak post halving in 2020.
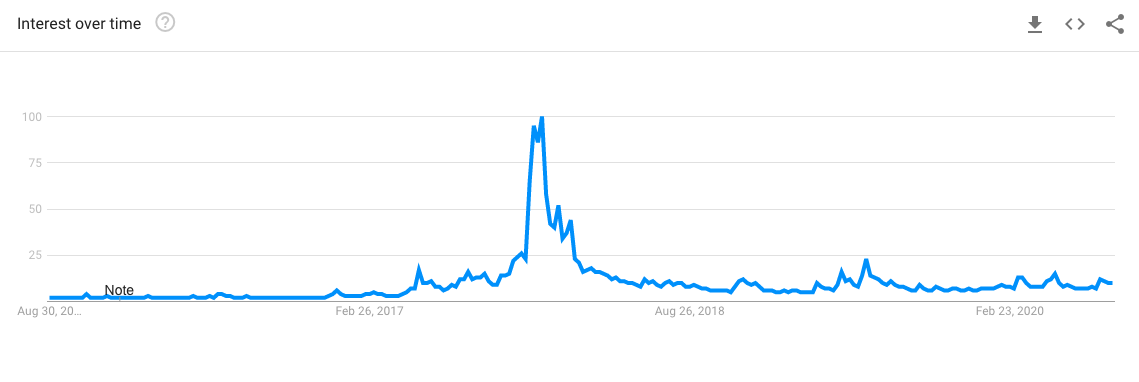
Source: Google Trends
The increase in institutional interest and retail buying has kept the price stable at a bullish level and miner capitulation has hit historic market bottoms. This indicated a bullish trend in the long term.
Digging into market data and trends leads us to the above conclusions. Keeping an eye on Bitcoin’s price and BTC sell-side orders on crypto-crypto exchanges is recommended in the short run.