Bitcoin demand is strong affirms prominent crypto-trader

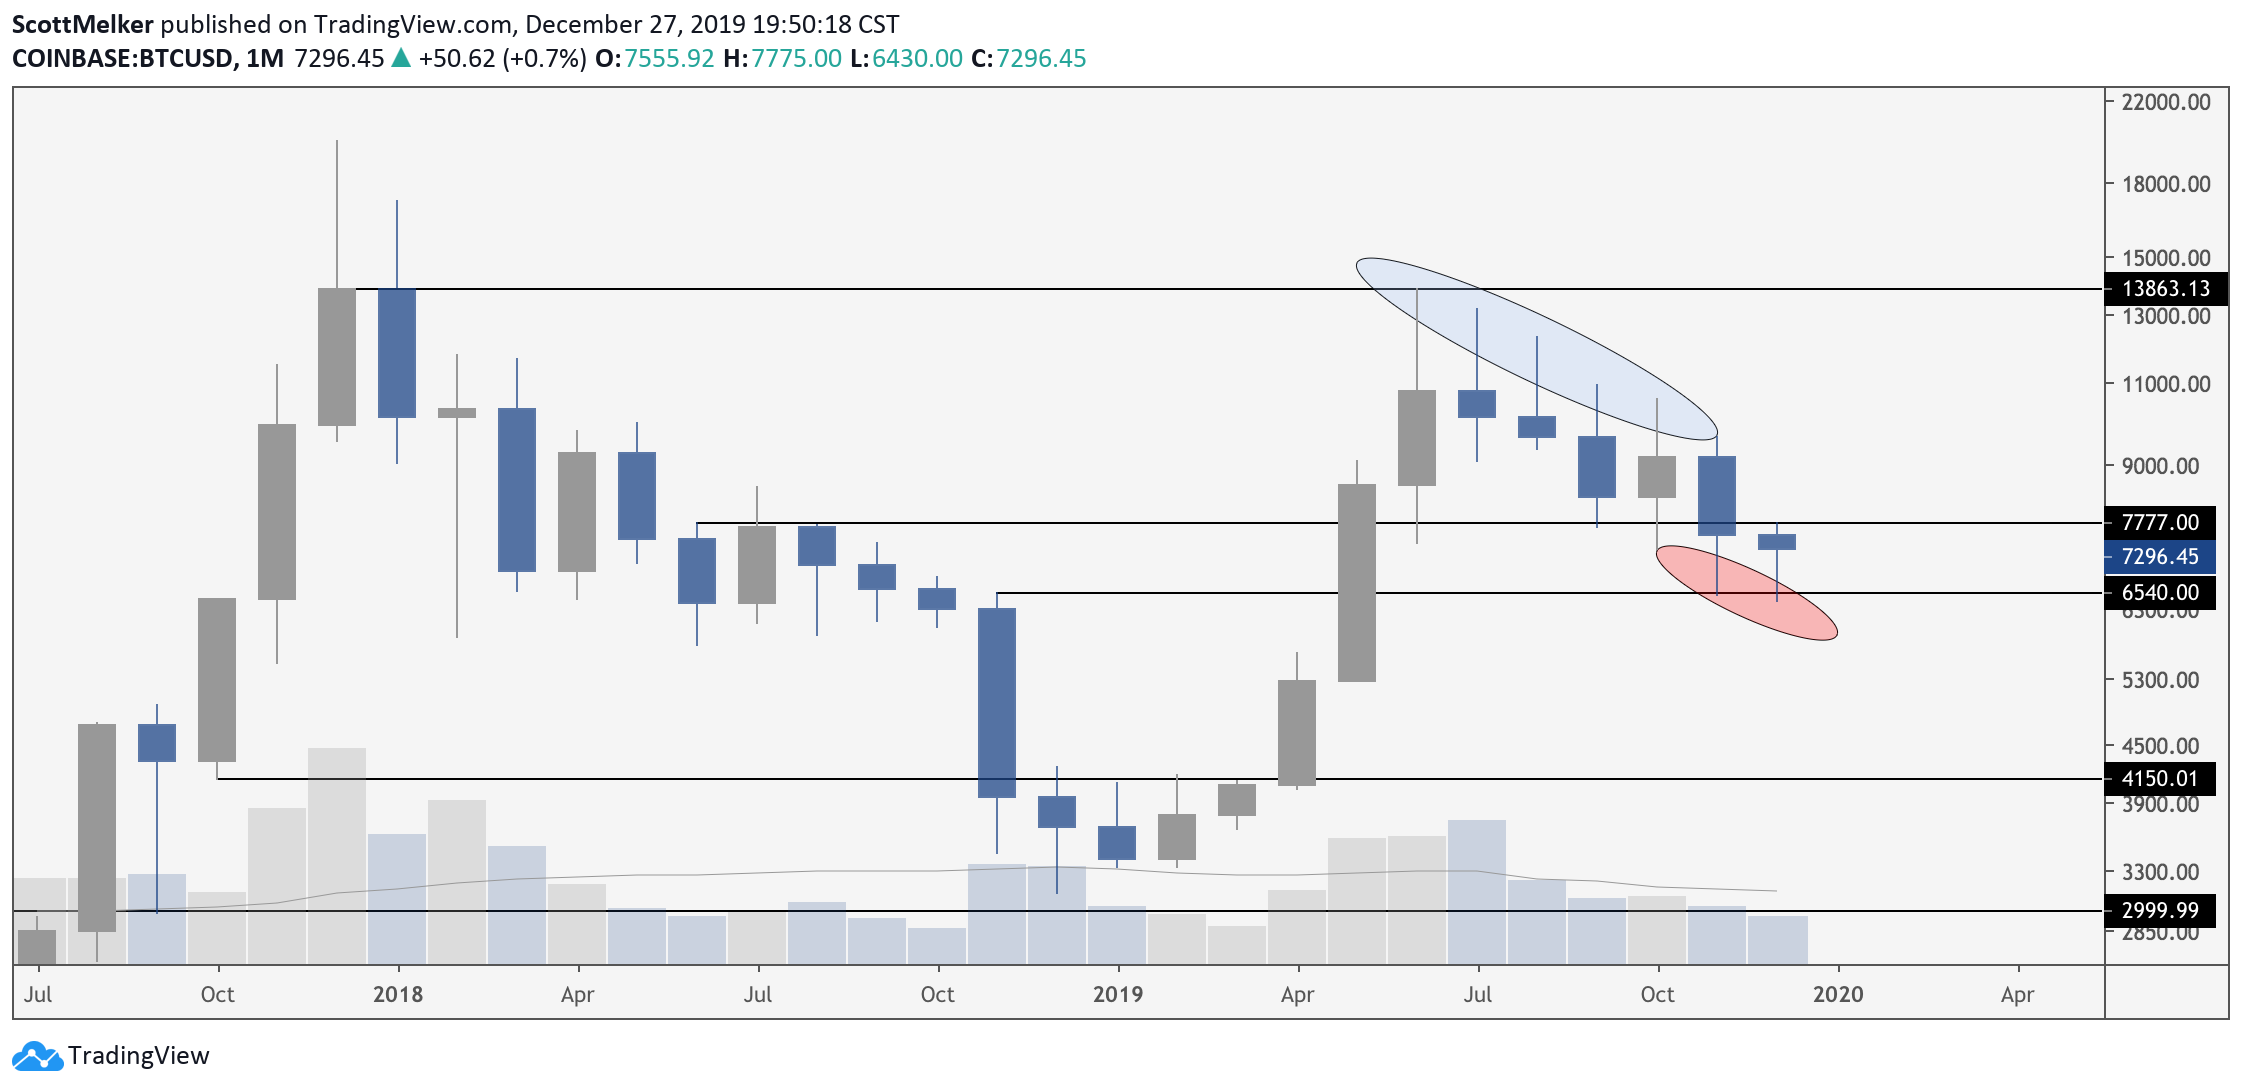
In a recent thread on Twitter, popular cryptocurrency trader, Scott Melker, posted his findings on analyzing candle wicks on the monthly Bitcoin charts.
Wicks usually show the extent to which an asset’s price fluctuated between the open and close of the candle’s time frame. Long upper wicks near a peak indicate market participants are trying to sell as high as possible, increasing selling pressure and driving the price down. Long lower wicks near a valley, however, show traders are looking to buy at the lowest price possible, increasing buying pressure and driving the price up.

Source: @scottmelker on Twitter
Melker, who goes by ‘The Wolf of All Streets’ on Twitter, noted that since May, when BTC nearly touched $14,000, the successive monthly candles’ upper wicks have been receding in length, becoming shorter and shorter toward October.
In a similar fashion, he pointed out how the monthly candles after October showed increasing lengths in their lower wicks, with the month of October itself showing a balance in length between upper and lower candle wicks. According to Melker, this indicated strong BTC selling pressure during the rally earlier this year, as well as stronger buying on dips.

Source: @scottmelker on Twitter
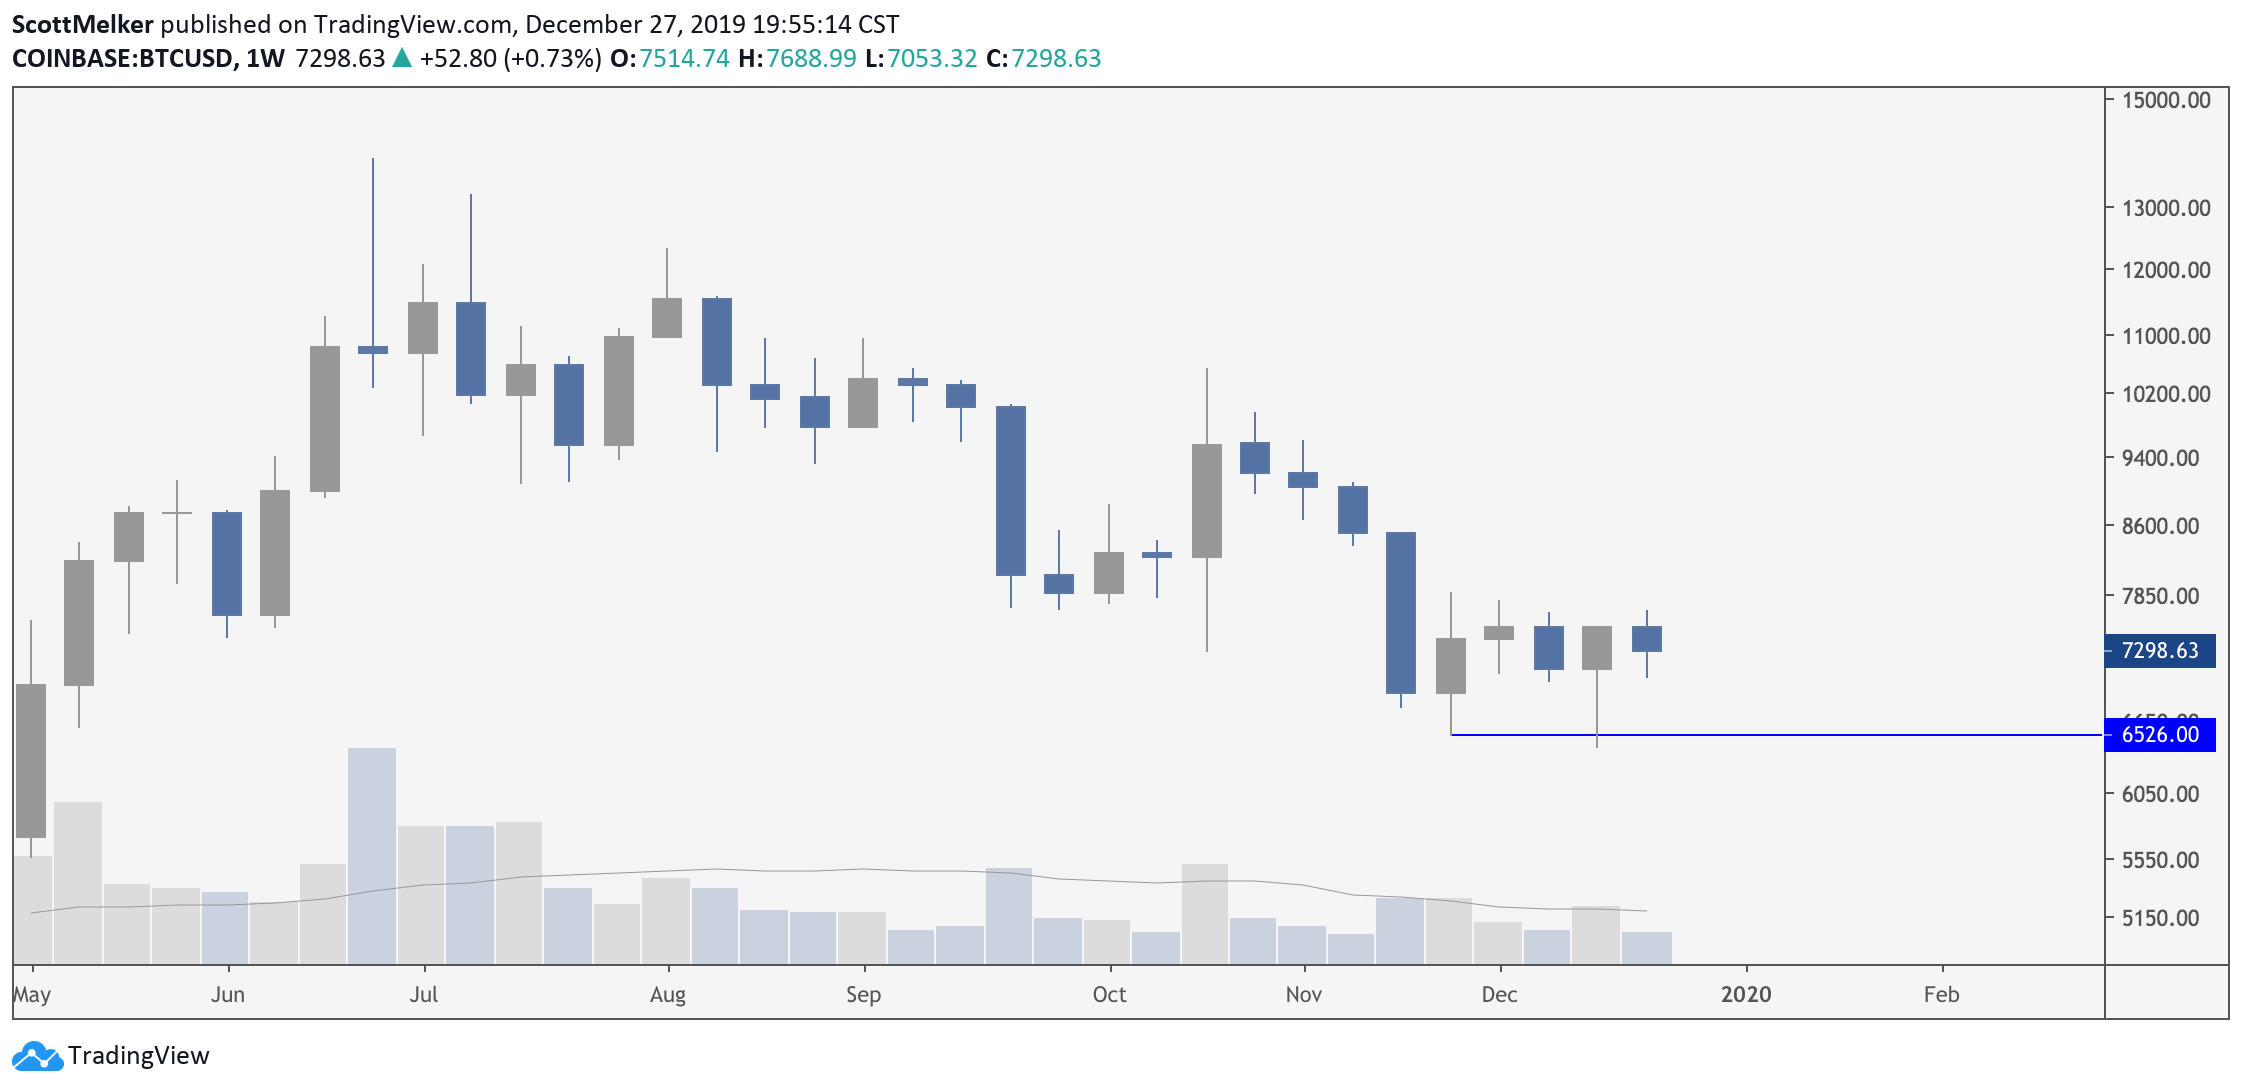
Additionally, Melker affirmed his hypothesis that demand is strong by drawing attention to the previous week’s swing failure pattern. Further, he claimed that BTC’s last weekly candle’s wick crossing under the last swing’s low indicated the “price was pushed down to fit orders — engineered liquidity.”

Source: BTCUSD on TradingView
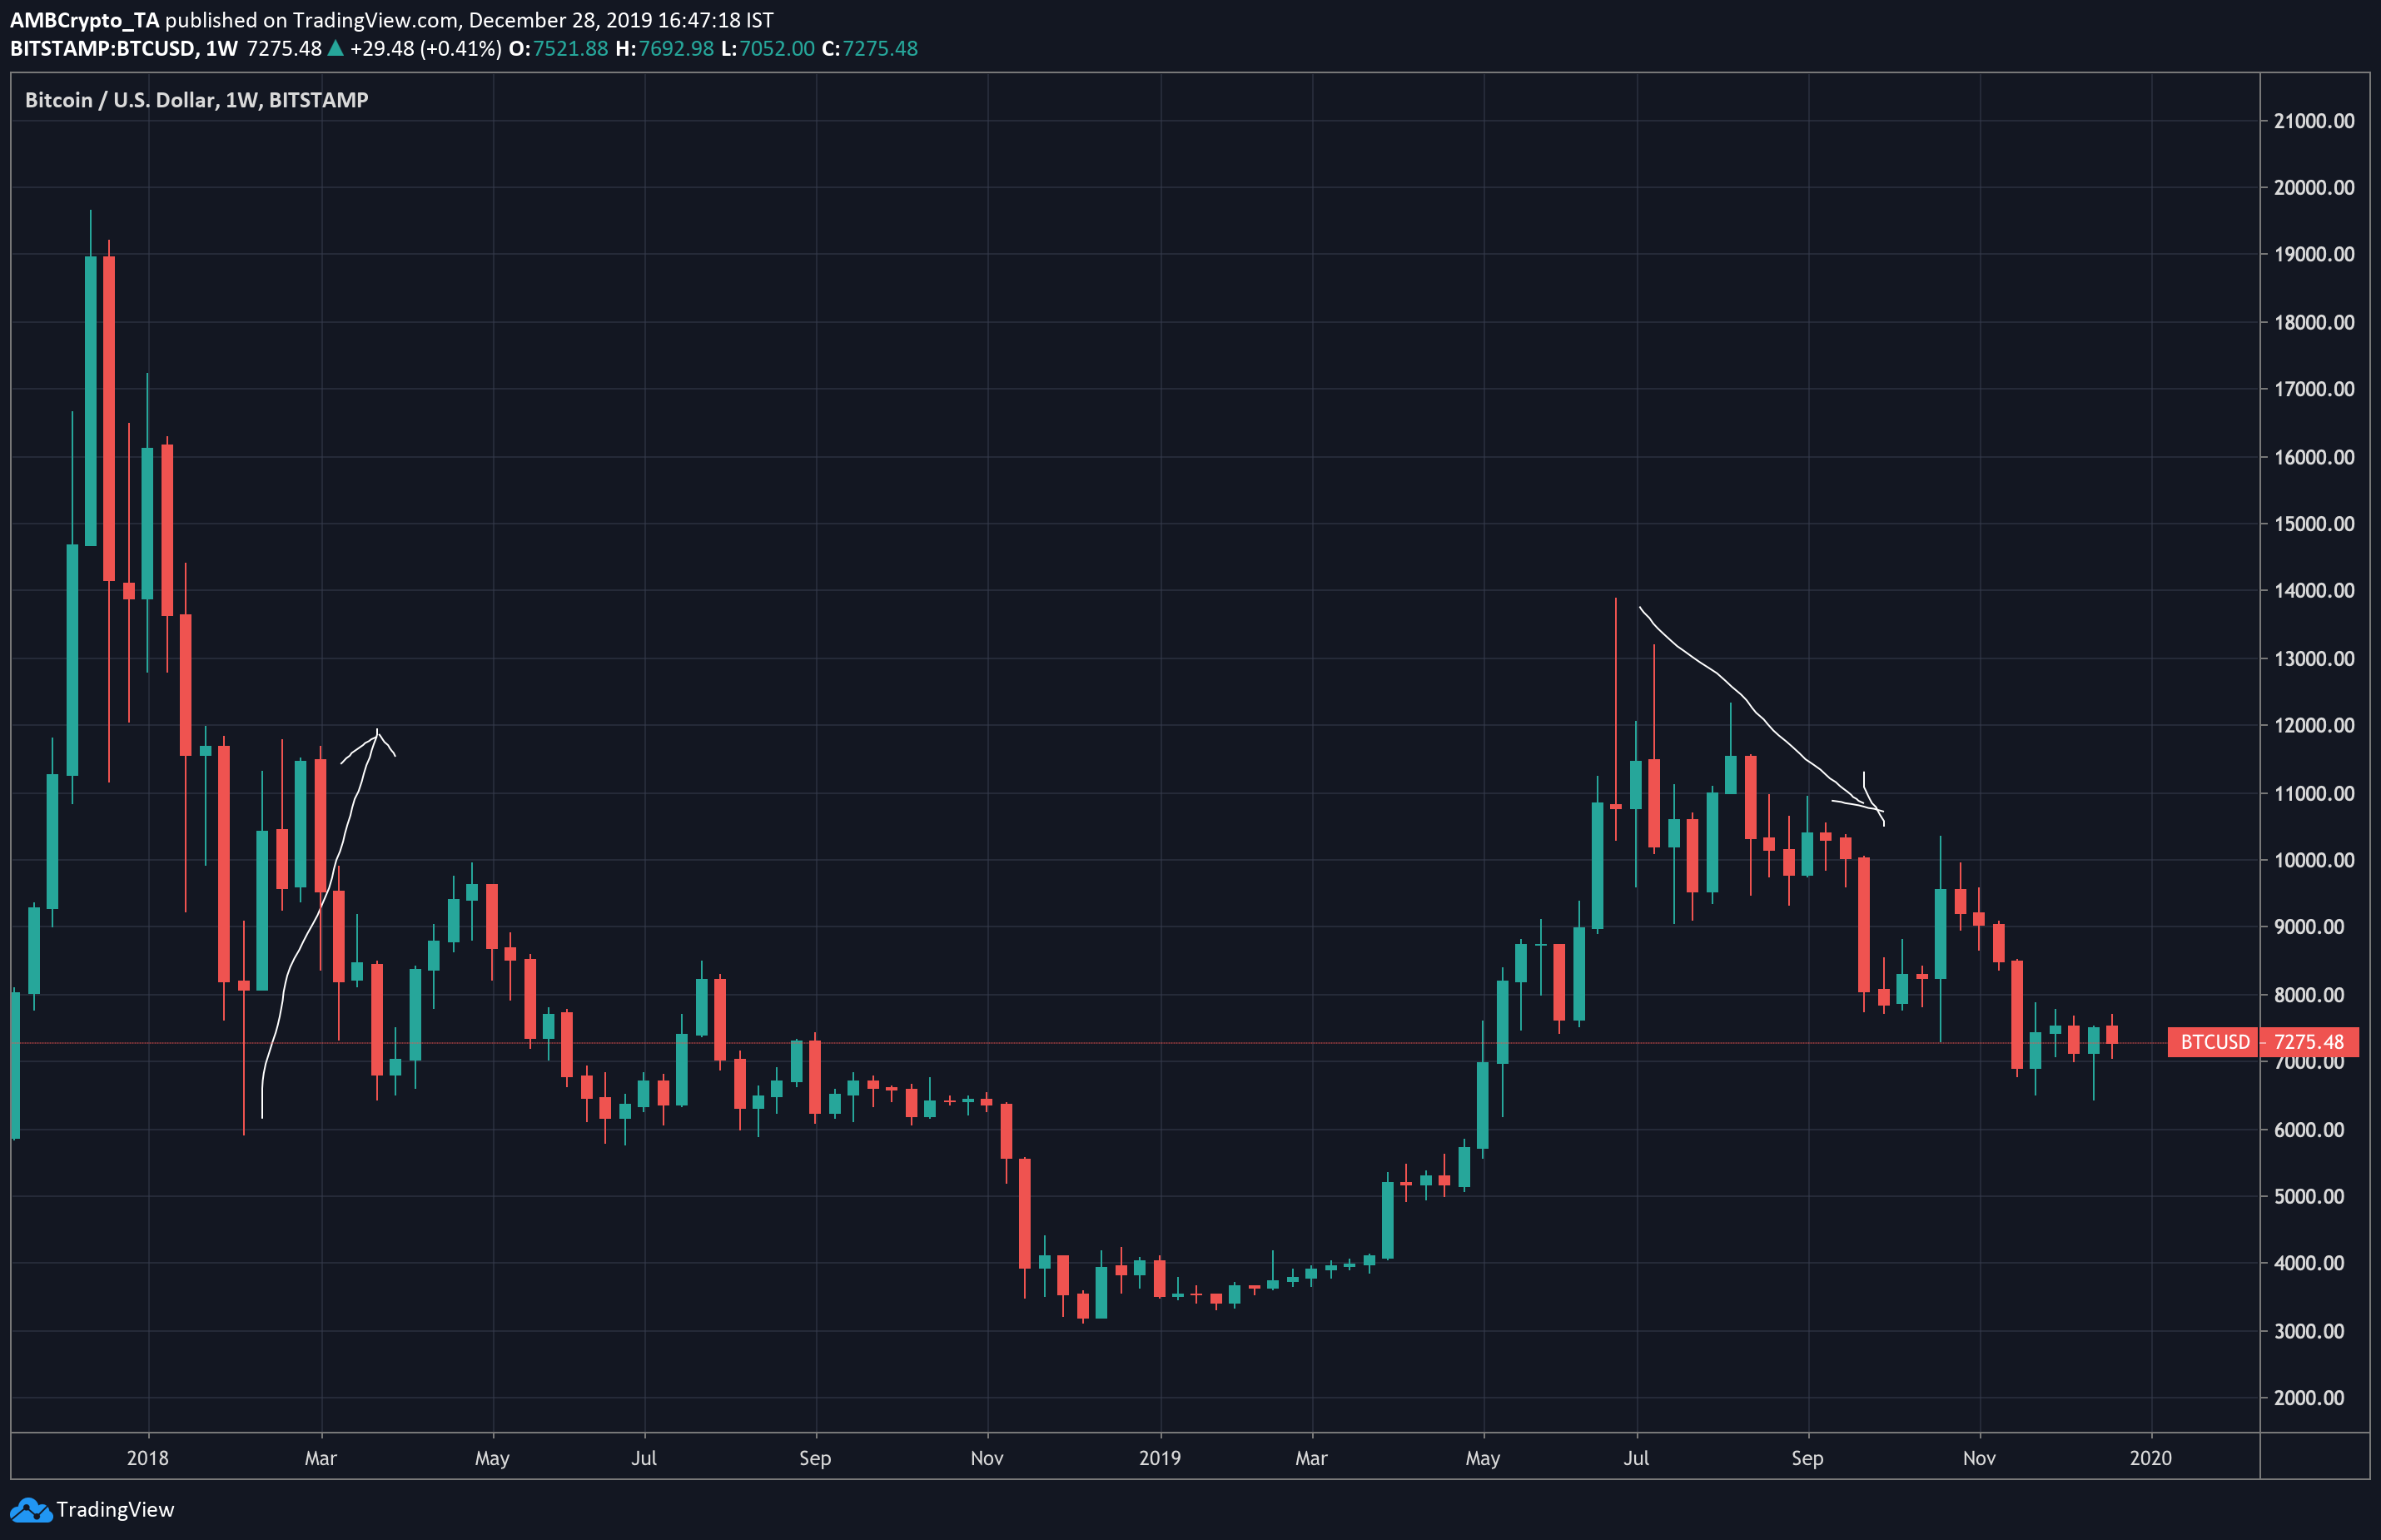
While not a flawless basis on which to expect a bull market, a look at the historical data for Bitcoin‘s weekly price shows candles with long wicks have tended to precede considerable movement in BTC value. As the market looks to buy at lower and lower levels, it seems likely that sellers will continue to prop the price up higher and higher, possibly leading to a gradual rise in Bitcoin value over the coming weeks and months.


