Bitcoin, Crypto.com, Compound Price Analysis: 28 October

The divergence is the digital asset industry is fairly evident at the moment with Bitcoin moving up and the rest of the altcoins moving south. While major altcoins in the top-20 depreciated largely over the past week, certain tokens did manage to picture identical growth in comparison to Bitcoin.
Bitcoin [BTC]

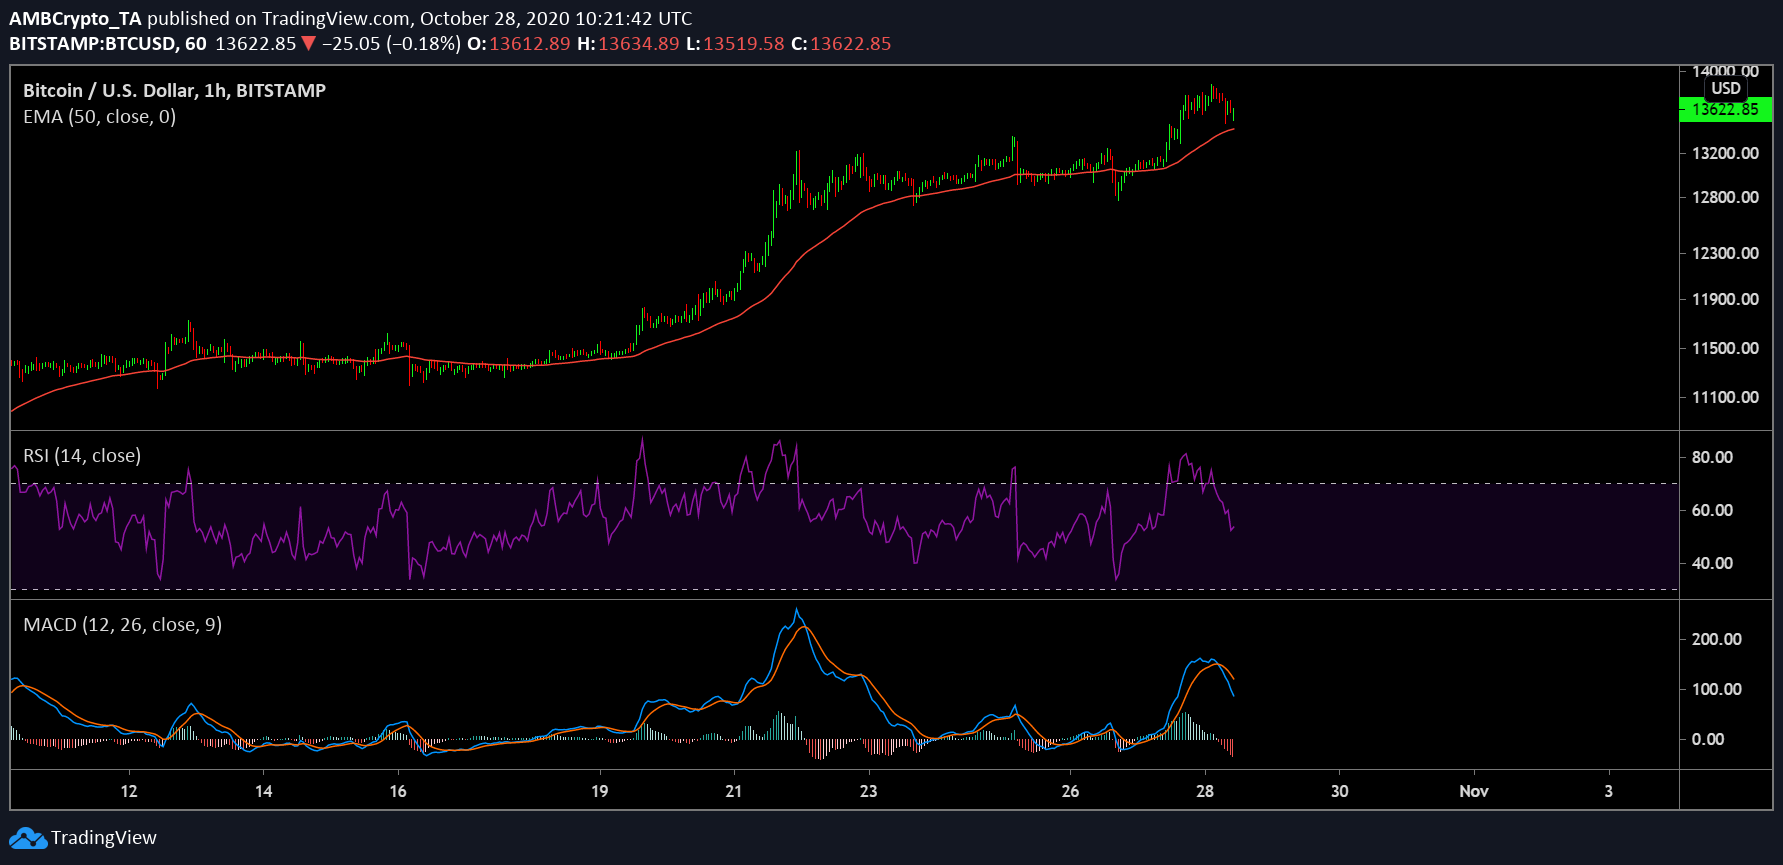
Source: BTC/USD on Trading View
The 1-hour chart of Bitcoin is currently on a blistering pace to attain a new 2020 yearly high after registering a high of $13,880 over the past few hours. While the price went down to $13,622 at press time, it continued to hold a level above the 50-Moving Average, indicating a bullish trend.
Bitcoin has a market cap of $252 billion, which was accompanied by a trading volume of $37 billion. Picturing a growth of 3.84 percent over the past day, its weekly returns were an impressive 11.89 percent.
However, at press time market indicators were turning a little bearish, with MACD suggestive of a bearish crossover. Likewise, the Relative Strength Index or RSI indicated improving sell pressure.
Crypto.com Coin [CRO]

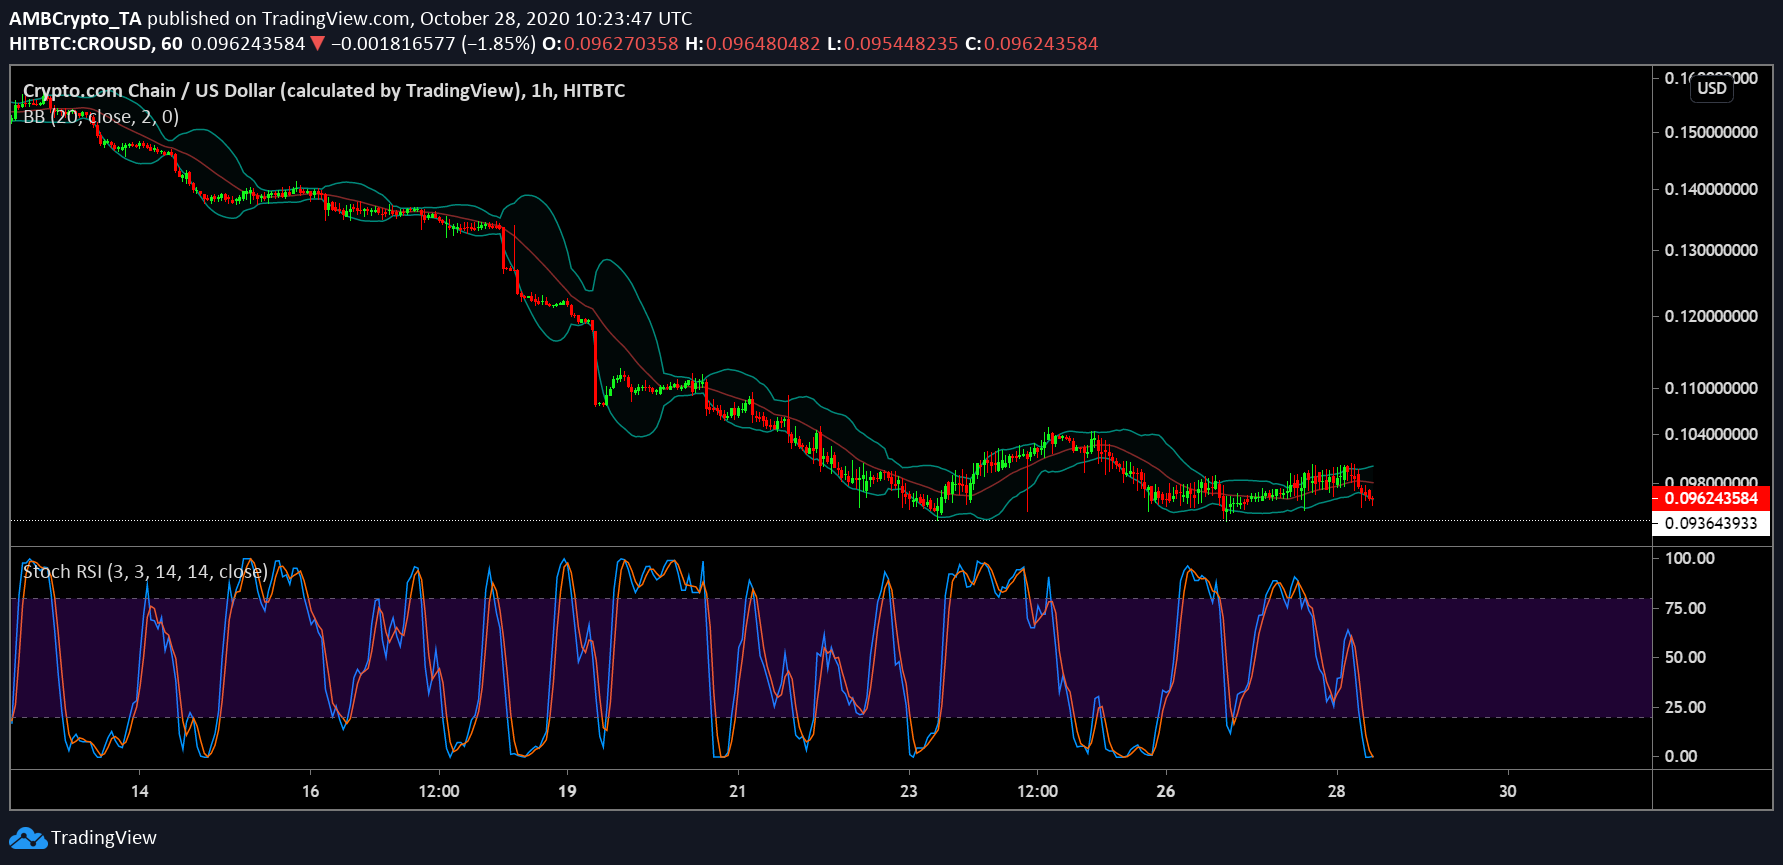
Source: CRO/USD on Trading View
While Bitcoin managed to reach towering heights, Crypto.com coin was down to 15th in the charts. Attesting a valuation near its June 1st lows at support $0.093, Crypto.com coin registered a market cap of $2 billion. While its daily decline was minimal at 0.92 percent, over the past-week its value had dropped b 9.27 percent.
At press time, the consolidation above the aforementioned support is a positive sign for reversal. Bollinger Bands were identified to diverge in the charts, indicative of a volatile market in the near future. Stochastic RSI was also close to a bullish crossover at the over-sold position, which may translate into a positive period for the token.
Compound [COMP]

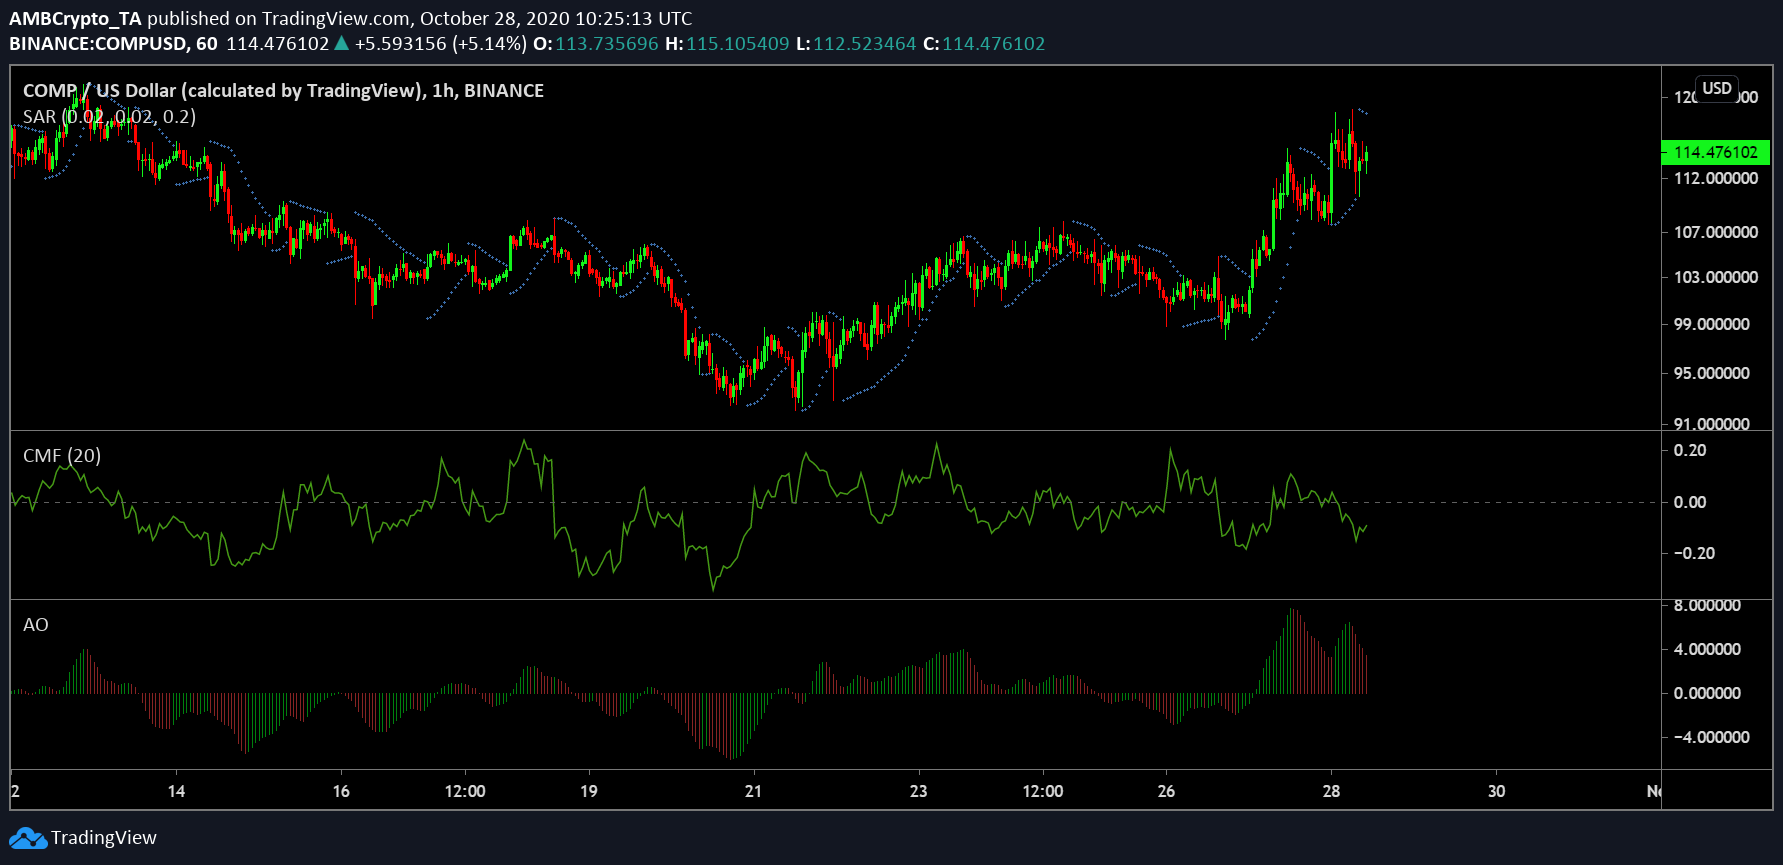
Source: COMP/USD on Trading View
Surprisingly, Compound remained one of the few altcoins that was able to mirror Bitcoin over the past week. Its growth of 17.26 percent in the last 7-days is commendable as its market cap improved to $457 billion.
While an average trading volume of $140 million capped off its daily proceedings, its 24-hour growth remained impressive with 4.45 percent.
On the other hand, its bullish trend might take a downturn now with Parabolic SAR, and Awesome Oscillator projecting strong bearish signals. AO indicated an increase of bearish momentum, while the dotted line(Parabolic SAR) hovered above the candles.
Capital Inflows also dropped below the zero-line, indicative of higher cash outflows.


