Bitcoin Cash short-term Price Analysis: 29 July

Disclaimer: The following article attempts to analyze the evolving trends in the Bitcoin Cash market and its impact on the price.
Bitcoin Cash’s spot market has been moving with great vigor as the asset tried to rise higher. Over the past few days, the consolidating price of Bitcoin Cash [BCH] began marching upwards, which resulted in the formation of a bullish pattern.

Source: BCH/USD on TradingView
This rising trend could be possible due to Bitcoin’s rising price. The strong correlation between BCH and BTC could once again cause BCH’s value to escalate.
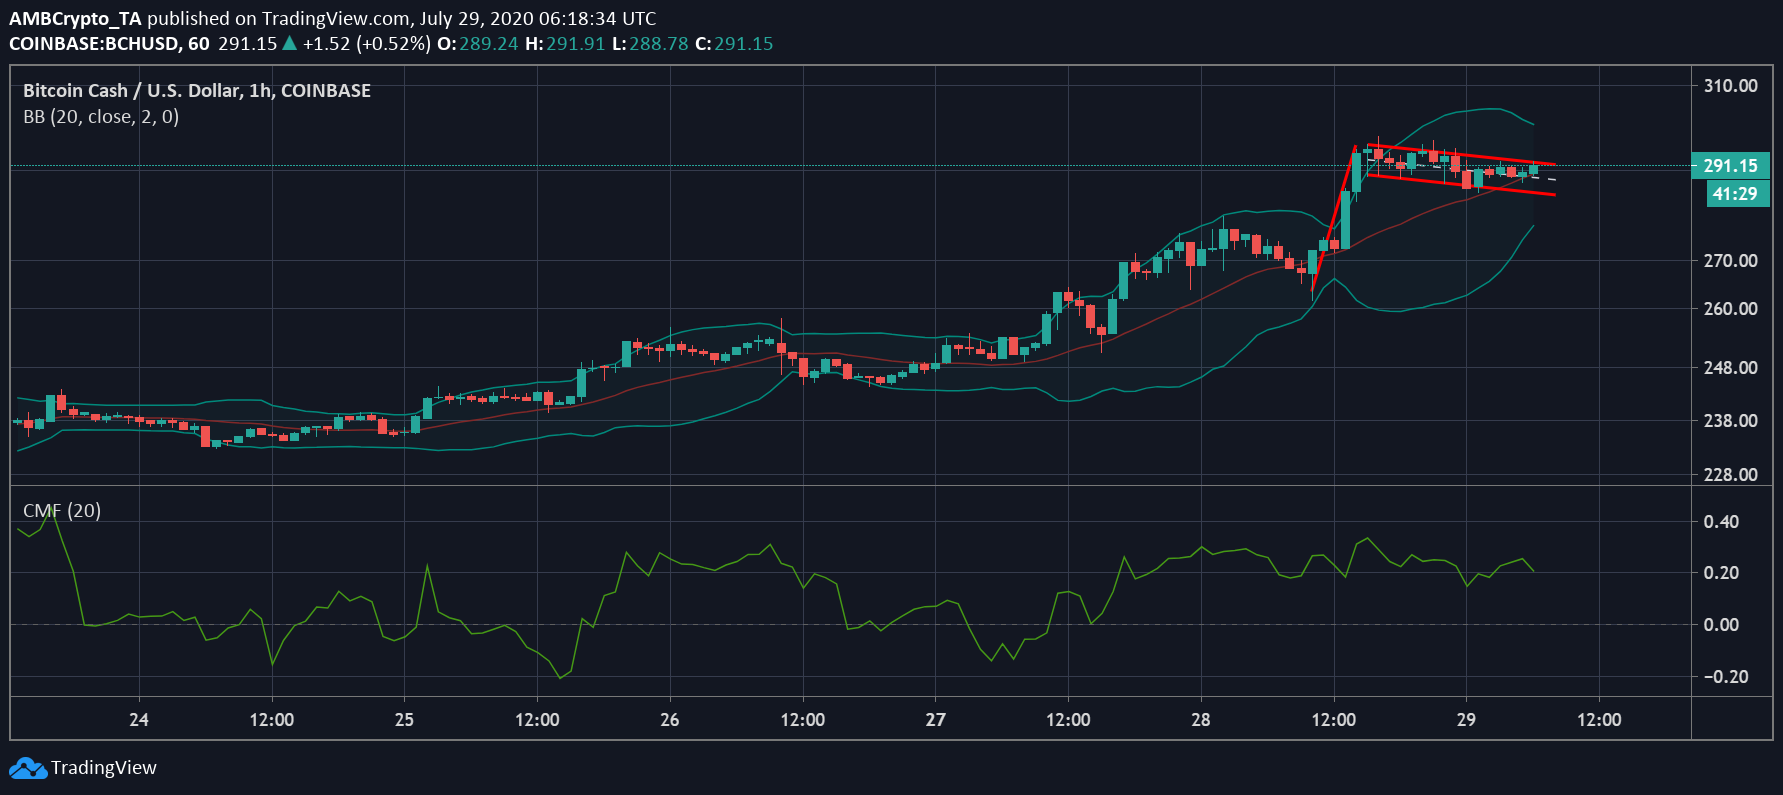
According to the one-hour chart of BCH, the sloping price saw strong upwards momentum a few hours back. This gave rise to strong green candles from a price point of $261.68 and $294.76. The price hike led to the formation of a pole, followed by a period of consolidation marked as the flag. This bullish flag pattern signaled an upwards breakout at least till the price point of $294.76, to confirm the breakout.
While the overall trend in the market has also been bullish as the signal line of Bollinger bands remained under the candlesticks, indicating the rising price. Whereas the bands appeared to form a big bubble towards the end, indicating the rise in volatility in the market. While the Chaikin Money Flow [CMF] also noted this uptrend as the indicator remained in the buying territory.

Source: BCH/USD on TradingView
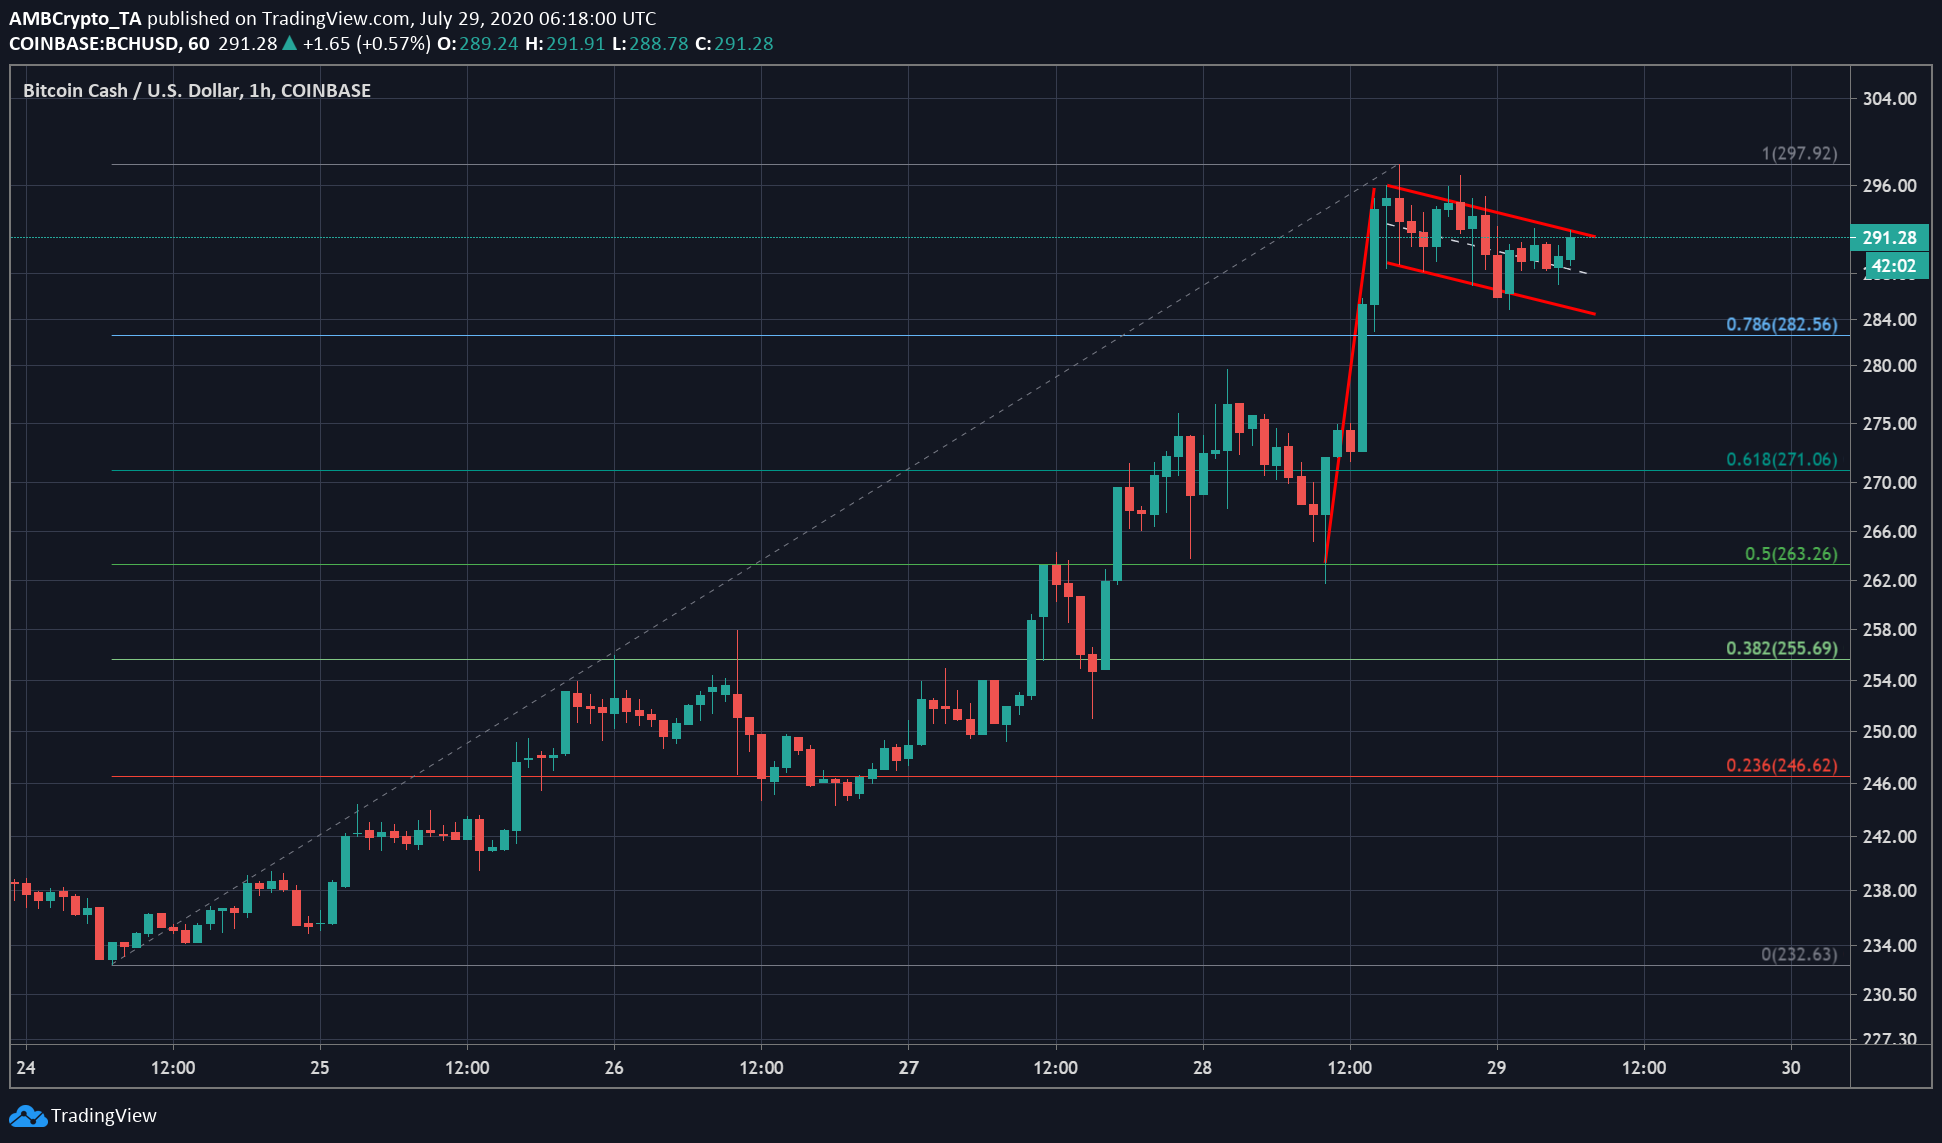
As the price of the asset was forming a bullish flag, the value has been moving lower. However, the coin’s price has been moving along the slope offering good support, as it expected another boost to $294. The Fib Retracement tool has marked the strong support points for the coin’s value. According to this the next resistance to be cade by the BCH after the breakout will be at $297.92, whereas, the support was much lower at $282.
If the coin failed to hold up the value during the consolidation phase, it may slip to $271.06. It may further move to a price point of $263.26. However, currently, the immediate resistance for BCH was fixed at $294.

