Bitcoin Cash short-term Price Analysis: 14 October

Disclaimer: The findings of the following article attempt to analyze the emerging patterns in Bitcoin Cash’s short-term market and its impact on the price.
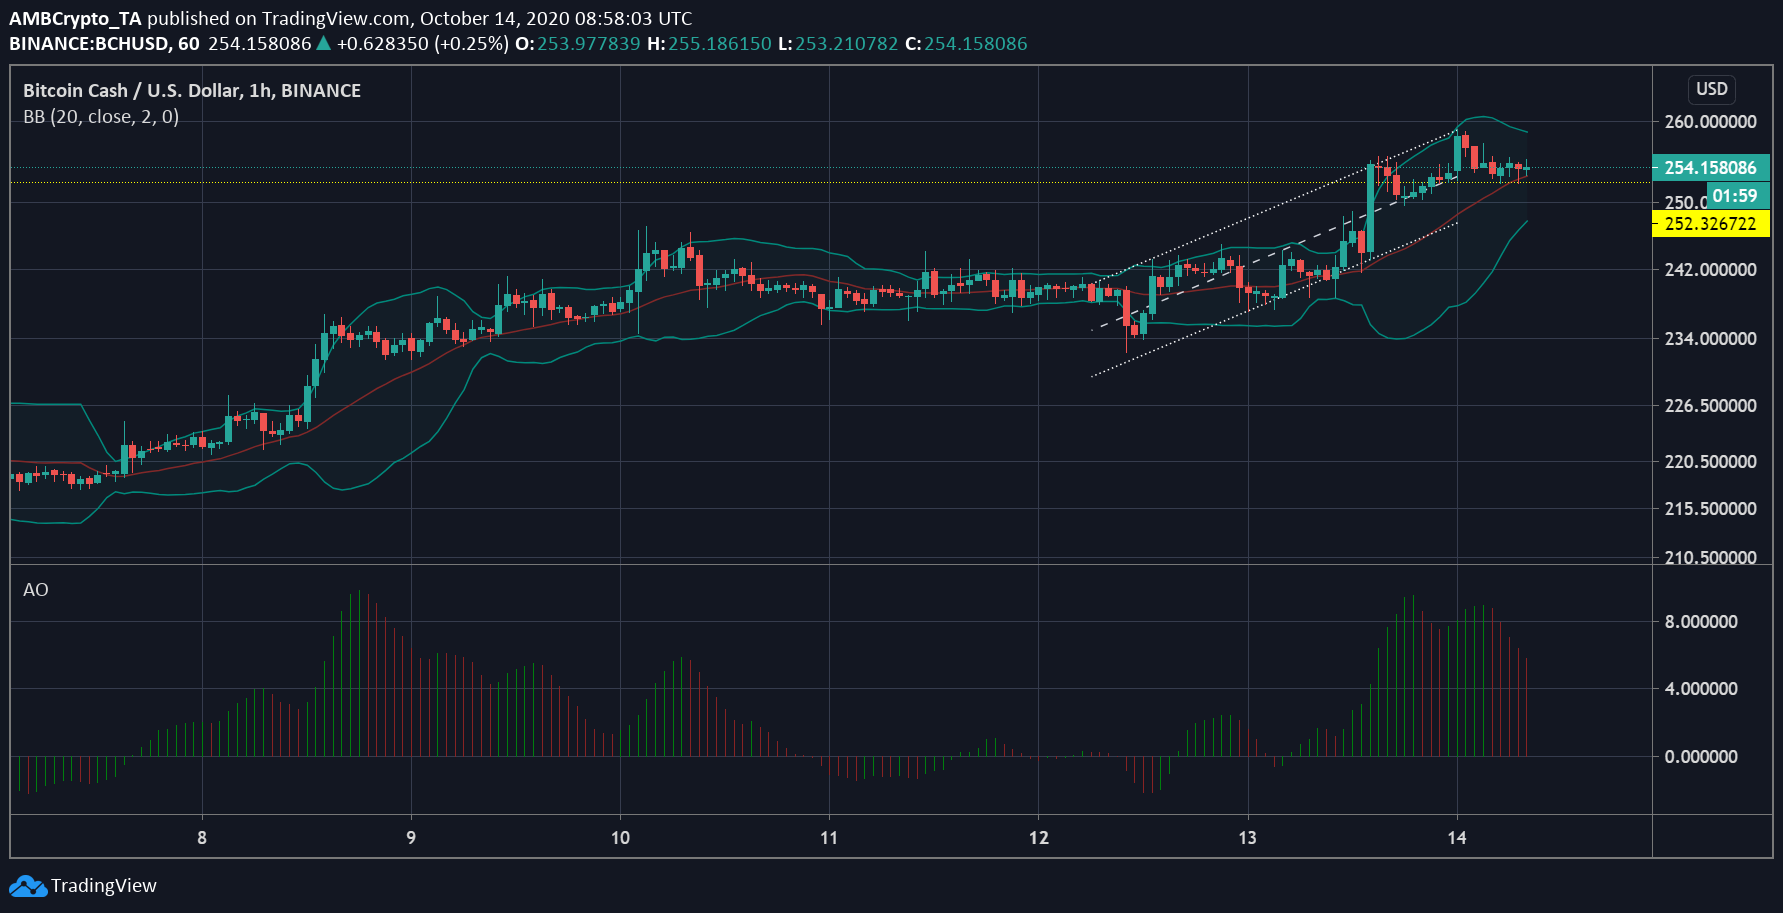
The Bitcoin Cash price has been recovering from its early September drop. This recovery was set rolling over the past couple of days when the Awesome Oscillator indicator went above the zero-line, indicating that the short-term momentum was increasing compared to the long term. This was considered to be a bullish buying opportunity and was highlighted in the strong green bars.
The current value of the digital asset was $252.96 and was closely hovering to the support at $252.32.

Source: BCH/USD on TradingView
As the short-term bullish trend was coming to an end, the volatility in the market was reducing as highlighted by the converging Bollinger Bands. The signal line was under the candlesticks but was moving higher for crossing above them.
This move of signal line clubbed with the reducing bullish buying opportunity could hint at a trend reversal. The green bars of the AO were switched by red bars, noting the short-term momentum was decreasing. The BCH resistance could be at $258, but the coin has tested this level just once after falling. Thus, a journey above this point may have to wait until the short-term momentum catches up.

Source: BCH/USD on TradingView
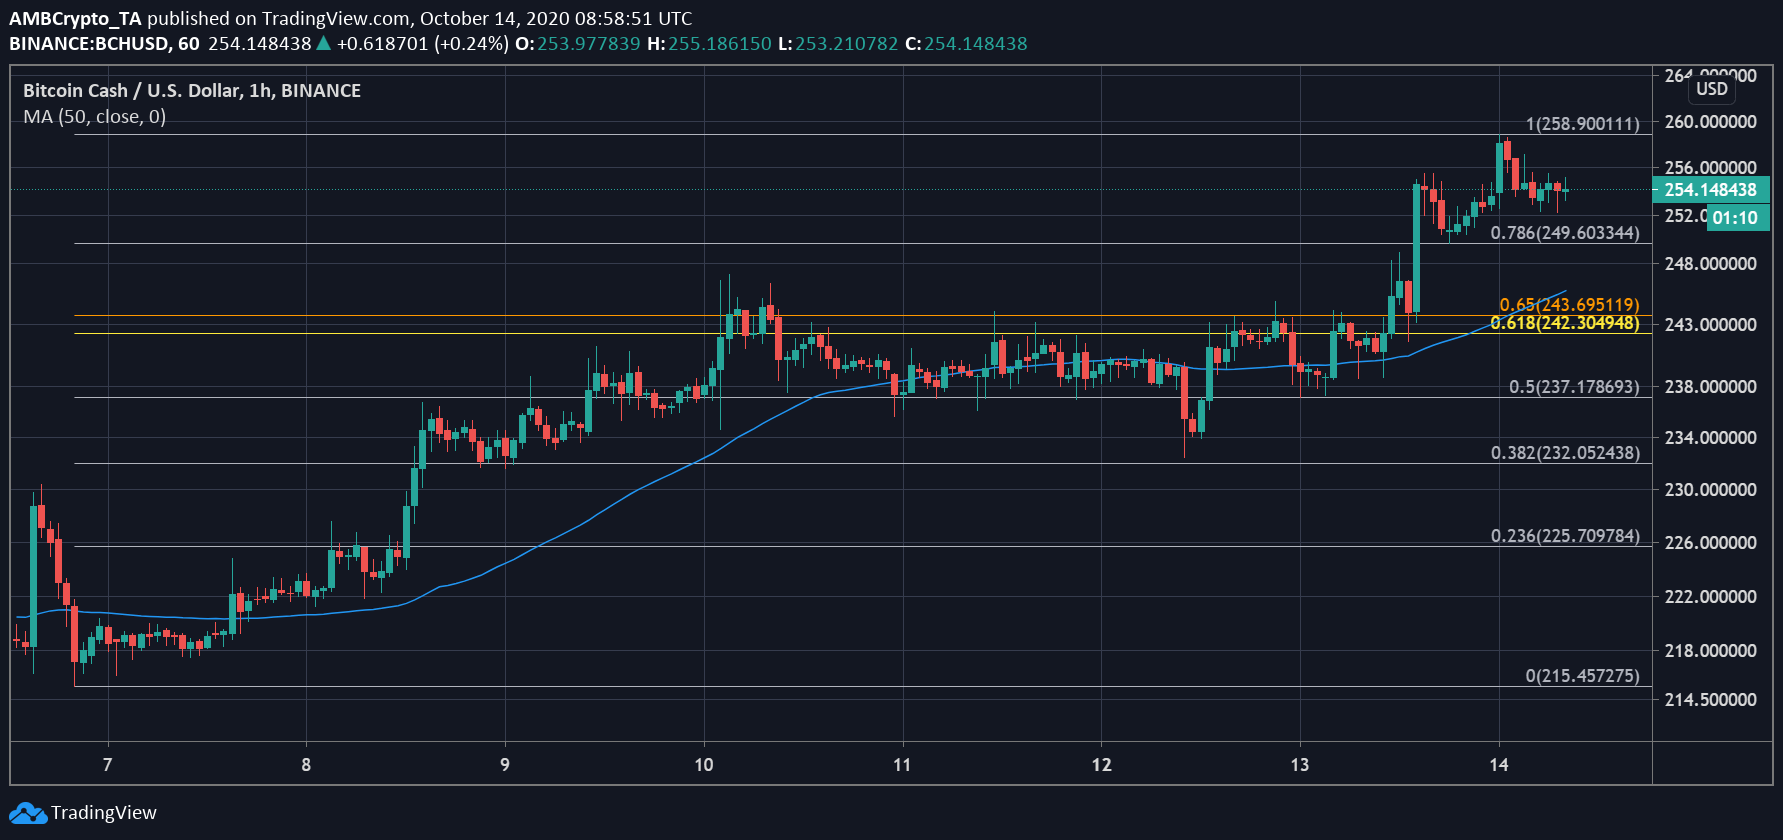
The Fibonacci retracement levels for the given period noted that the major trade level for BCH was between $237 and $242. The price surged past the resistance at $243 and peaked at $258.90 before retracing. The current support for the coin according to the Fib levels will be at $249.60, and a dip under this could confirm the trend reversal.
Whereas the 50 moving average currently spells a bullish rise in the market, which has not yet flipped. The 50 MA acted as a resistance for the coin until the boost took over the BCH market. At press time, the MA was psychological support for the digital asset.
