
Bitcoin Cash has been caught in a bearish phase and has been on a constant decline. At press time, BCH held a market cap of $5.53 billion and recorded a 24-hour trading volume of $1.40 billion. Following a minor appreciation of 1.0% in 24-hours, BCH was valued at $307.4.
1-day Chart Bitcoin Cash:
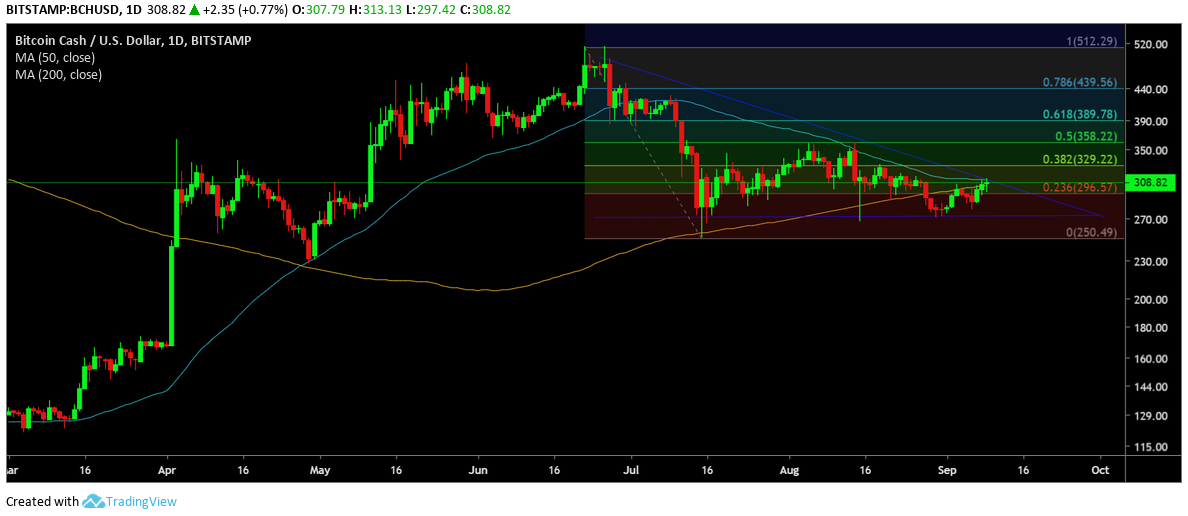
Source: TradingView
Bitcoin Cash hit an ATH on 22nd June 2019 when the fork coin climbed to a price of $512.55. According to the above chart, BCH remained within the Fib level of 0.786 and 0.618 before dropping below the 0.236 level briefly and hovered below the 0.382 Fib level. 50-day Moving Average line was close to 200-day Moving Average line and appeared to be heading for a death cross. This would imply the 50-day MA would drop below the 200-day MA, indicative of a major bearish phase for the cryptocurrency. The last time two moving averages underwent a cross-over was on 27th April when BCH had a Golden cross.
The above daily-chart exhibited a descending triangle pattern which pictured a potential decline in BCH’s price.
Scenario 1:
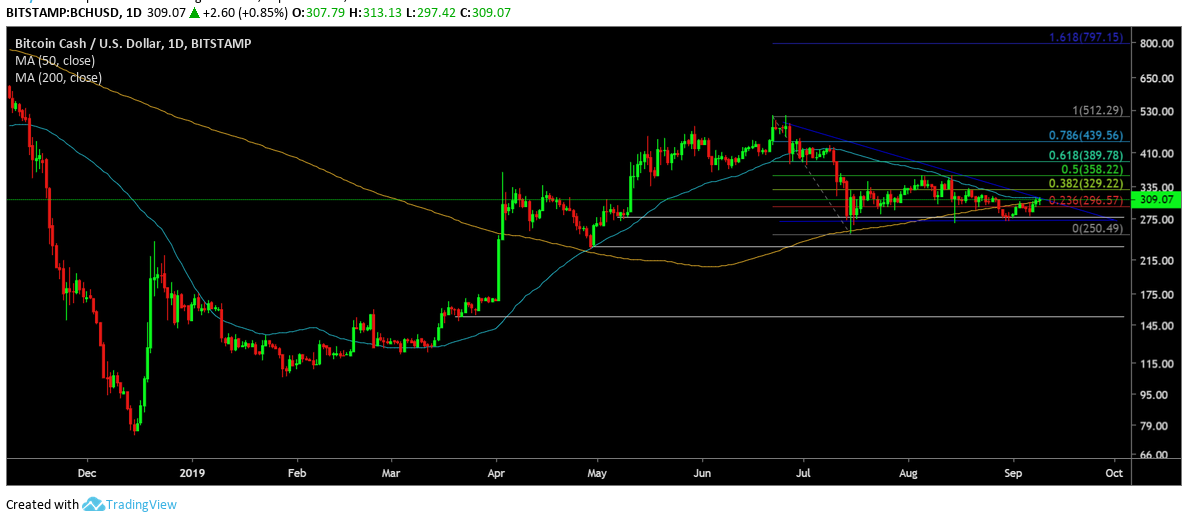
Source: TradingView
After the completion of the triangle, if the death cross comes to fruition, then BCH could possibly drop below key support levels. The first major support level for the coin was found at $277.6. A major bear trap would bring ab0ut a potential drop to the support level $232.6 or even collapse to a low of $151.
Scenario 2:
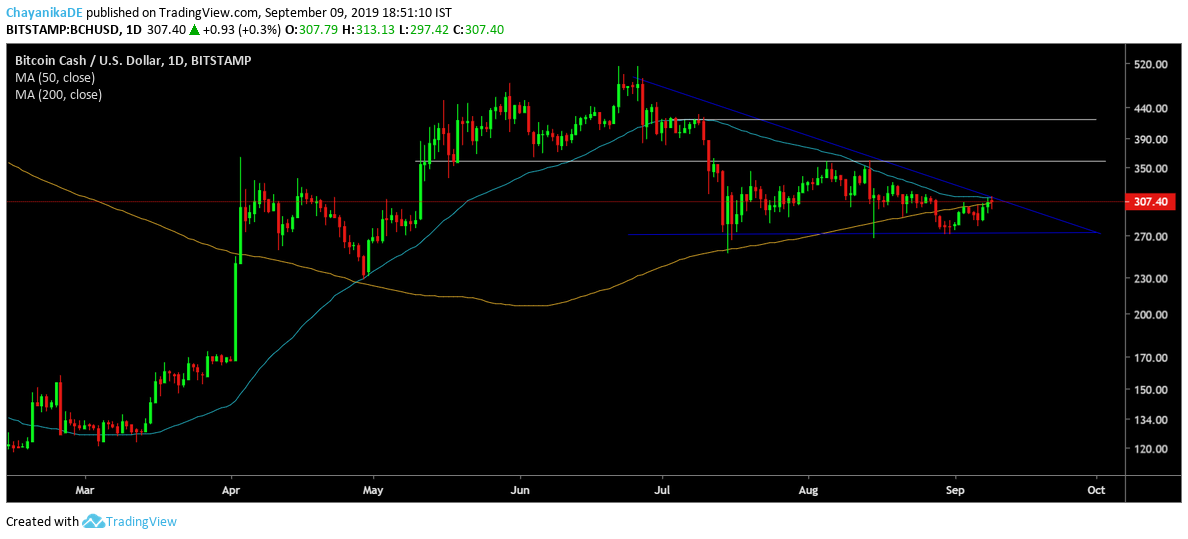
Source: TradingView
Another potential scenario could be 50-day MA line and the 200-day MA line parting ways instead of a death cross. In this case, the price could see an upward movement in the coming days. For the daily chart, potential resistances for the crypto was found at $358 and $420-levels.
1-Week Bitcoin Cash Chart:
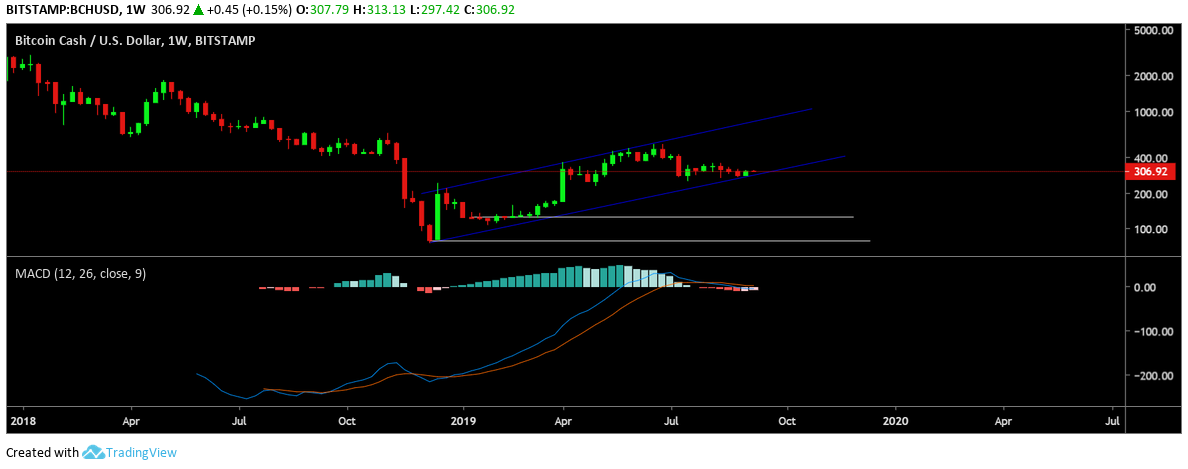
Source: TradingView
The weekly BCH chart depicted an ascending channel pattern extending for almost 9 months. This implies a potential downward price breakout after the completion of the channel. This could put the price of BCH at $124 and $78. Further supporting the decline in its price was the MACD indicator which depicted a bearish phase for the coin.
Conclusion:
Both the above long-term charts depicted a potential bearish phase for the coin. The daily chart indicated a possible death cross, while the daily chart depicted a strong bearish wave.