Bitcoin Cash faces re-test at $234

It has been a chaotic few days for digital assets; it started with Bitcoin breaching $10,000 range but within the next 24-hours, a $500 depreciation was witnessed.
Bitcoin Cash faced a similar situation but a noticeable trend suggested that the correction phase might have just begun for the fifth-largest digital asset.
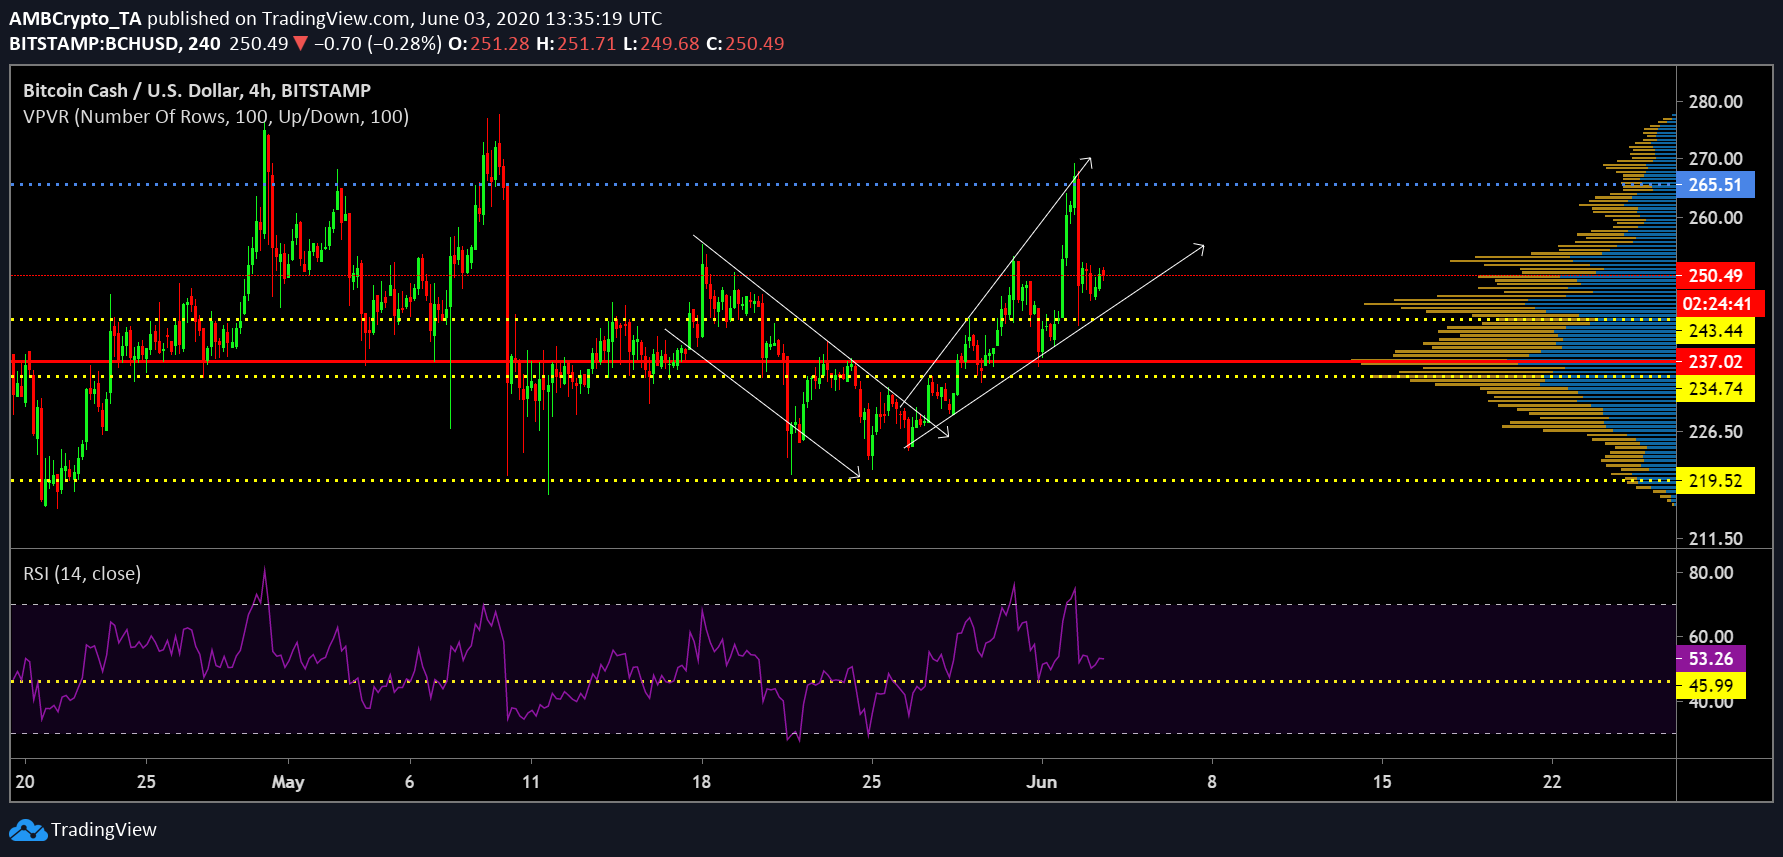
Bitcoin Cash 4-hour chart

BCH/USD on Trading View
From 17th May to 25th May, BCH’s price followed the path of a descending channel as the asset came close to testing its long-term support at $219. However, an uptrend breakout from the pattern ensured Bitcoin Cash’s breach of immediate resistance at $234. Since 28th May, the asset has been able to comply with the bullish narrative as resistance at $243 was breached. However, after a quick test of resistance at $265, the asset was back below $250.
Although the coin sustained above $250, an ascending broadening wedge appeared at press time. A pattern marked with a bearish breakout, BCH currently faces another retracement which may take the coin down to $234.
Relative Strength Index or RSI remained optimistic with buying pressure holding the upper hand against selling pressure.
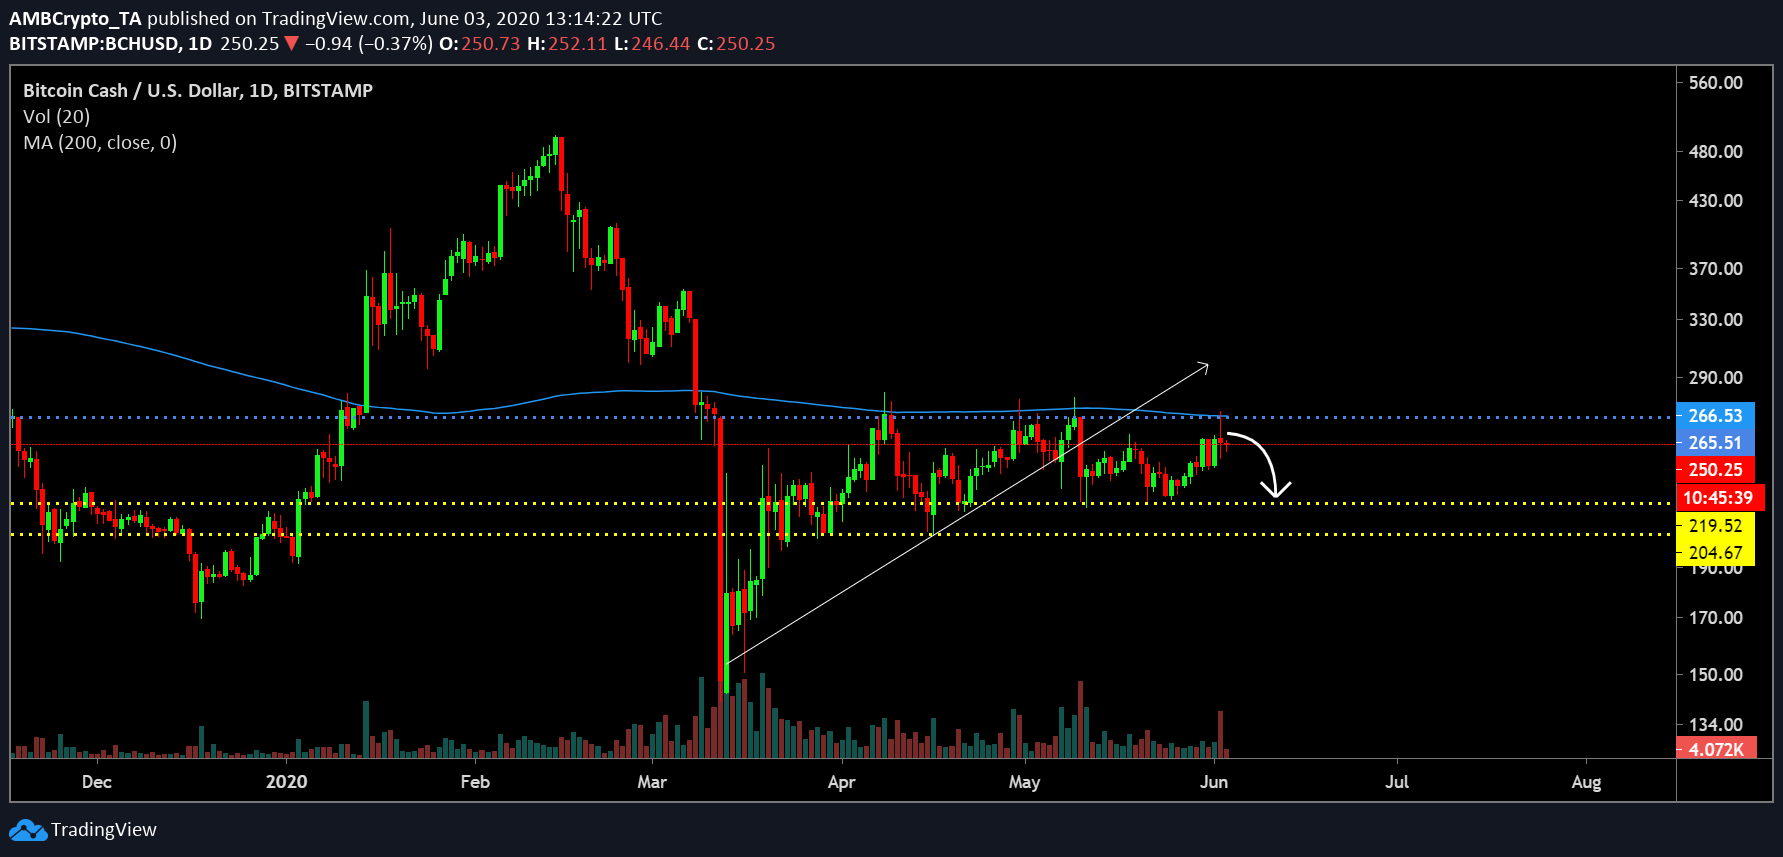
Bitcoin 1-day chart

BCH/USD on Trading View
With the 4-hour chart appearing extremely volatile, long-term chart of Bitcoin Cash provided more clarity. BCH has tested resistance at $265 four times since April 7th 2020.
The recent surge to the point of resistance was again thwarted by 200-Moving Average; consolidation between $266 and $219 remained imminent. With the exhaustion of buying pressure, the coin is most likely to attain another pullback to $219, which has been the case since April.
Conclusion
Although there has been a consistent indication for another rally, the coin looks primed for a period of correction before breaching resistance at $265. Support at $219 will hold firm but support at $234 might get breached over the next week.


