Bitcoin Cash, EOS, Dash Price Analysis: 07 February

The cryptocurrency market has been moving more or less in a synchronized manner. Although it felt like the alts were taking a lead with Ethereum hitting an all-time high, Bitcoin also rallied. Owing to a strong correlation with Bitcoin most of the crypto market witnessed a surge in price.
Bitcoin Cash [BCH]

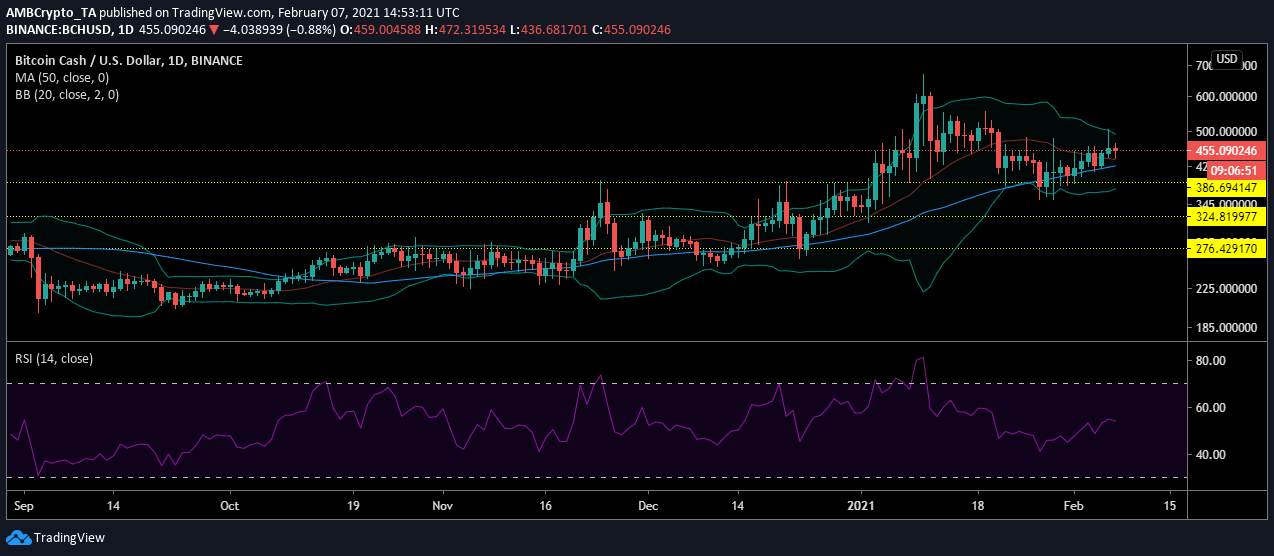
Source: BCHUSD on TradingView
The above chart of the Bitcoin hard fork, Bitcoin Cash indicated that the falling price reversed in the past week. The cryptocurrency started to rise and the trend that became evident was a bullish one.
The 50 moving average remained under the price bars, however, it was currently offering support to the rising value of BCH. The Bollinger Bands were indicating that the volatility in the market was reducing as the bands started to converge.
Meanwhile, the buyers and sellers were equal in the BCH market as the Relative Strength Index remained close to equilibrium. This could be a sign of a BCH market consolidation.
EOS

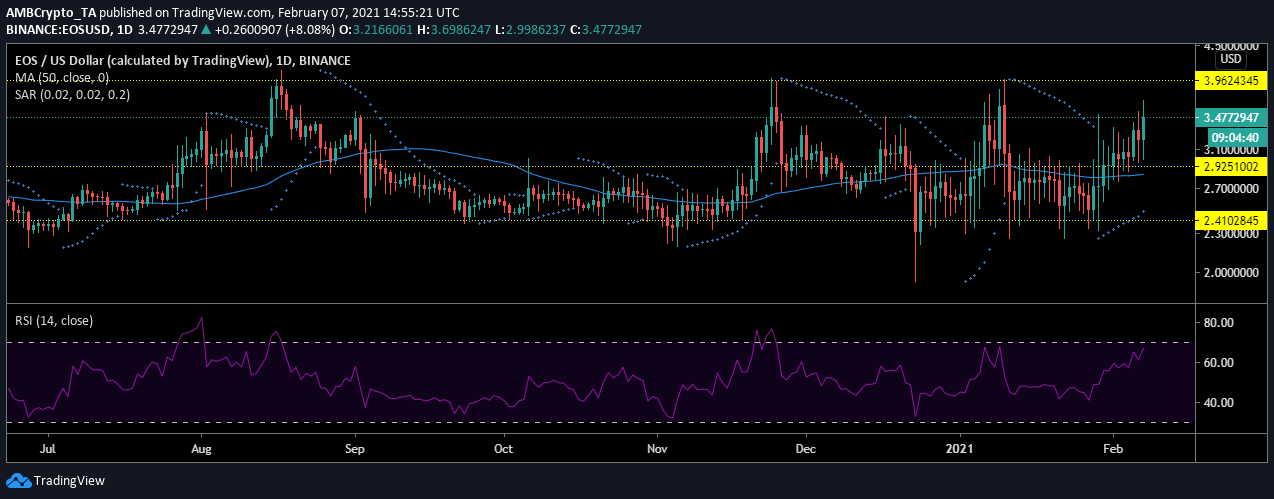
Source: EOSUSD on TradingView
EOS was also indicating extreme bullishness as its price was also showing a similar uptrend. However, this sudden surge caused the bears to disappear as the bulls took over.
The markers of the Parabolic SAR indicator signaled this bullishness as it settled under the candlesticks. However, the asset’s price was being supported at $2.92 and the 50 moving average remained under the price bars.
The EOS market was not yet indicating a reversal in the current bullish trend. Although the Relative Strength Index was moving towards the overbought zone, the resistance has remained higher at $3.96. The price may test this level once again, before a reversal.
Dash

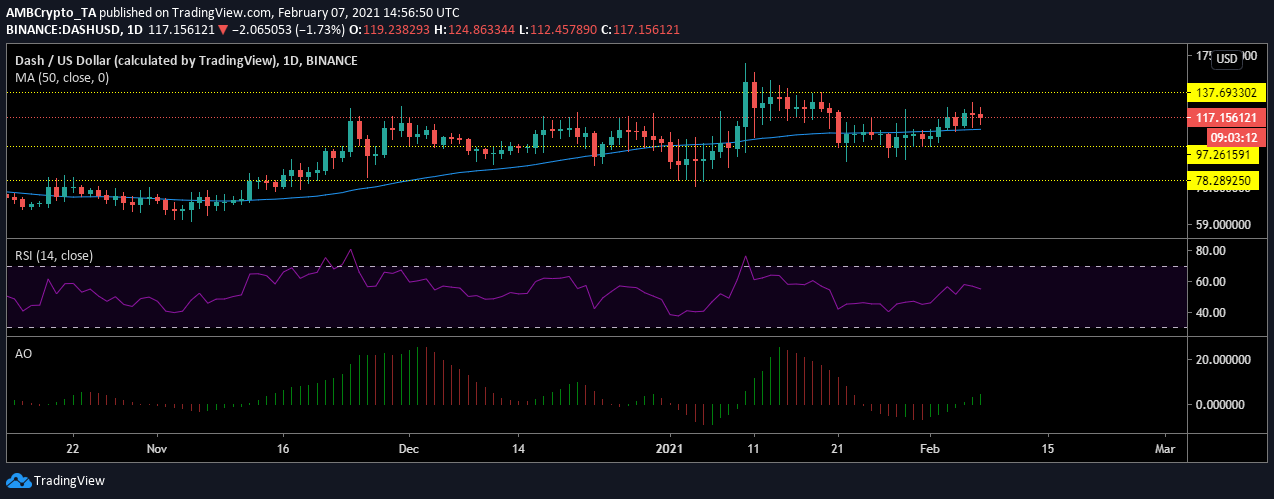
Source: DASHUSD on TradingView
The value of DASH pushed up from the support at $97, where it was seen consolidating. At the time of writing, despite a surge DASH was trading at $114, while the next resistance was noted to be at $137. However, the bearish trend has recently turned to a bullish one in the market and this could help move the coin towards the next resistance.
The market was witnessing a slight selling pressure at the current price level, but the Relative Strength Index indicated that it was not really strong pressure. The asset has remained close to the equilibrium zone for quite some time now and this selling pressure may not push the value much lower.
