
Bitcoin was trading at $15,550 and came close to the $16K price level for a very brief while and many coins that saw losses recently rose on the charts. Bitcoin Cash and Cosmos showed bullish divergences and posted strong gains as the altcoin market received positive impetus from buyers. VeChain also surged past levels of resistance and signaled a possible reversal in its long-term downtrend.
Bitcoin Cash [BCH]
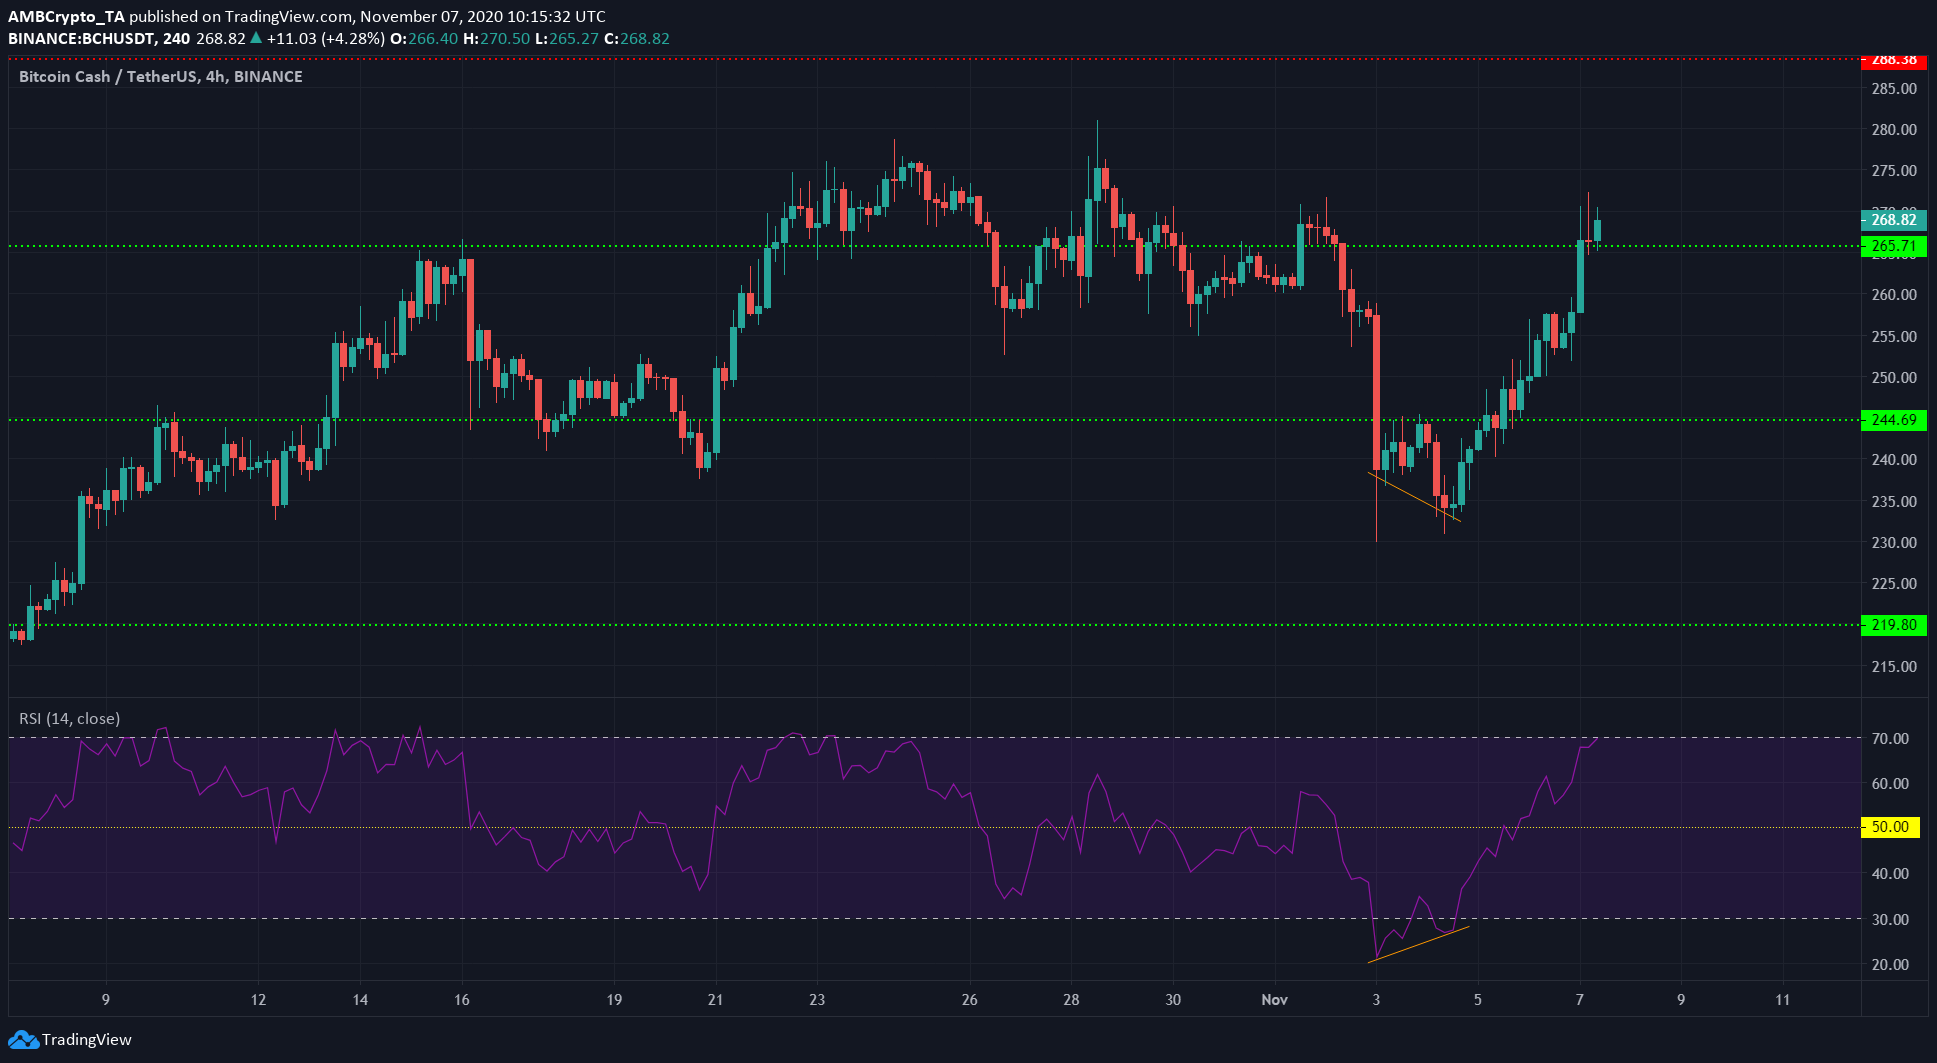
Source: BCH/USDT on TradingView
Bitcoin Cash formed a bullish divergence (orange) at its local bottom and subsequently saw a surge. This pump coincided with Ethereum’s move upward from $385.
This suggested that many of the large-cap coins are still influenced by strong moves by the largest of the altcoins.
Bitcoin Cash faced flipped $265 from resistance to support as the RSI was on the verge of signalling ‘overbought’. BCH could rise as high as $275 before facing a minor pullback.
Cosmos [ATOM]
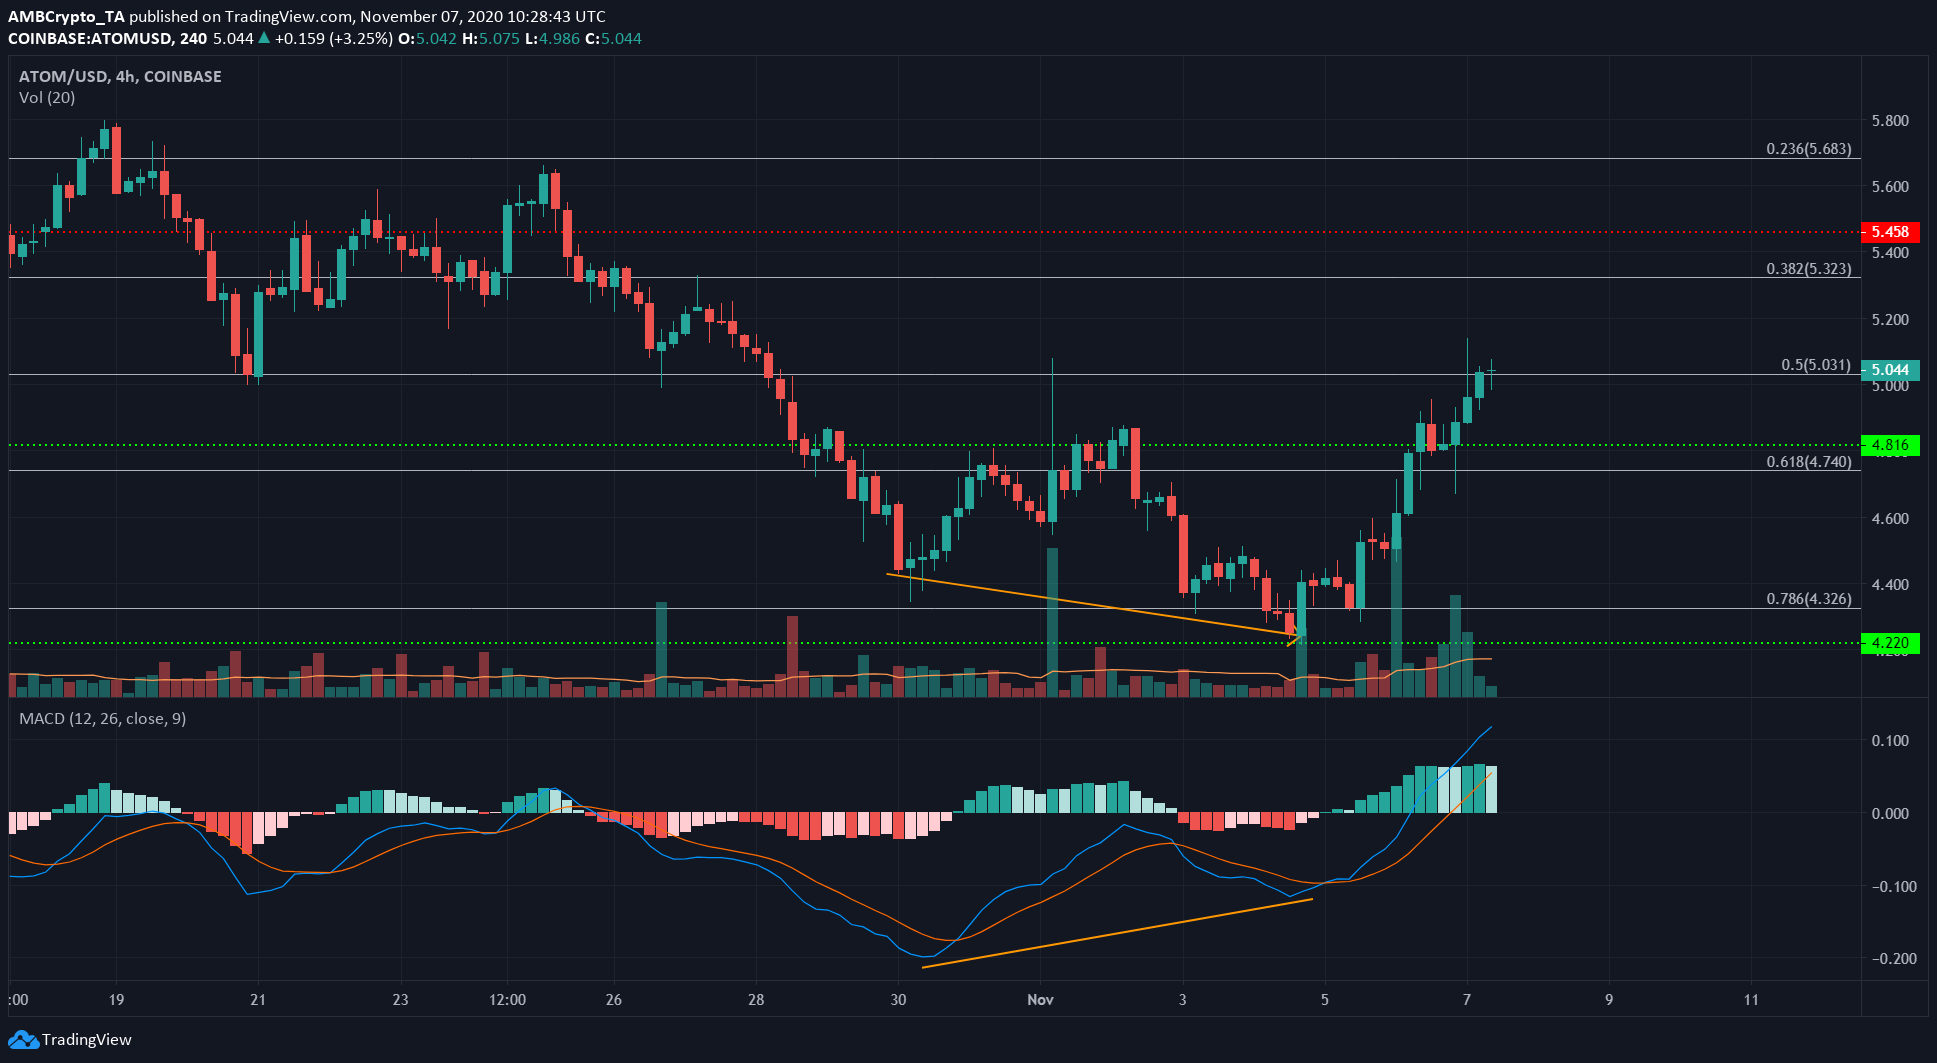
Source: ATOM/USD on TradingView
ATOM also exhibited a bullish divergence between price and momentum (orange), as the price formed a lower low while bearish momentum waned according to the MACD.
Some important levels of retracement were highlighted using Fibonacci Retracement for ATOM’s move upward to $3.8 to $6.26. ATOM was nestled just above the 50% retracement level at $5.
The MACD showed strong bullish momentum was yet unabated, and ATOM could face a minor pullback from $5 to $4.8, or climb further to $5.3 before witnessing a pullback to $5.
VeChain [VET]
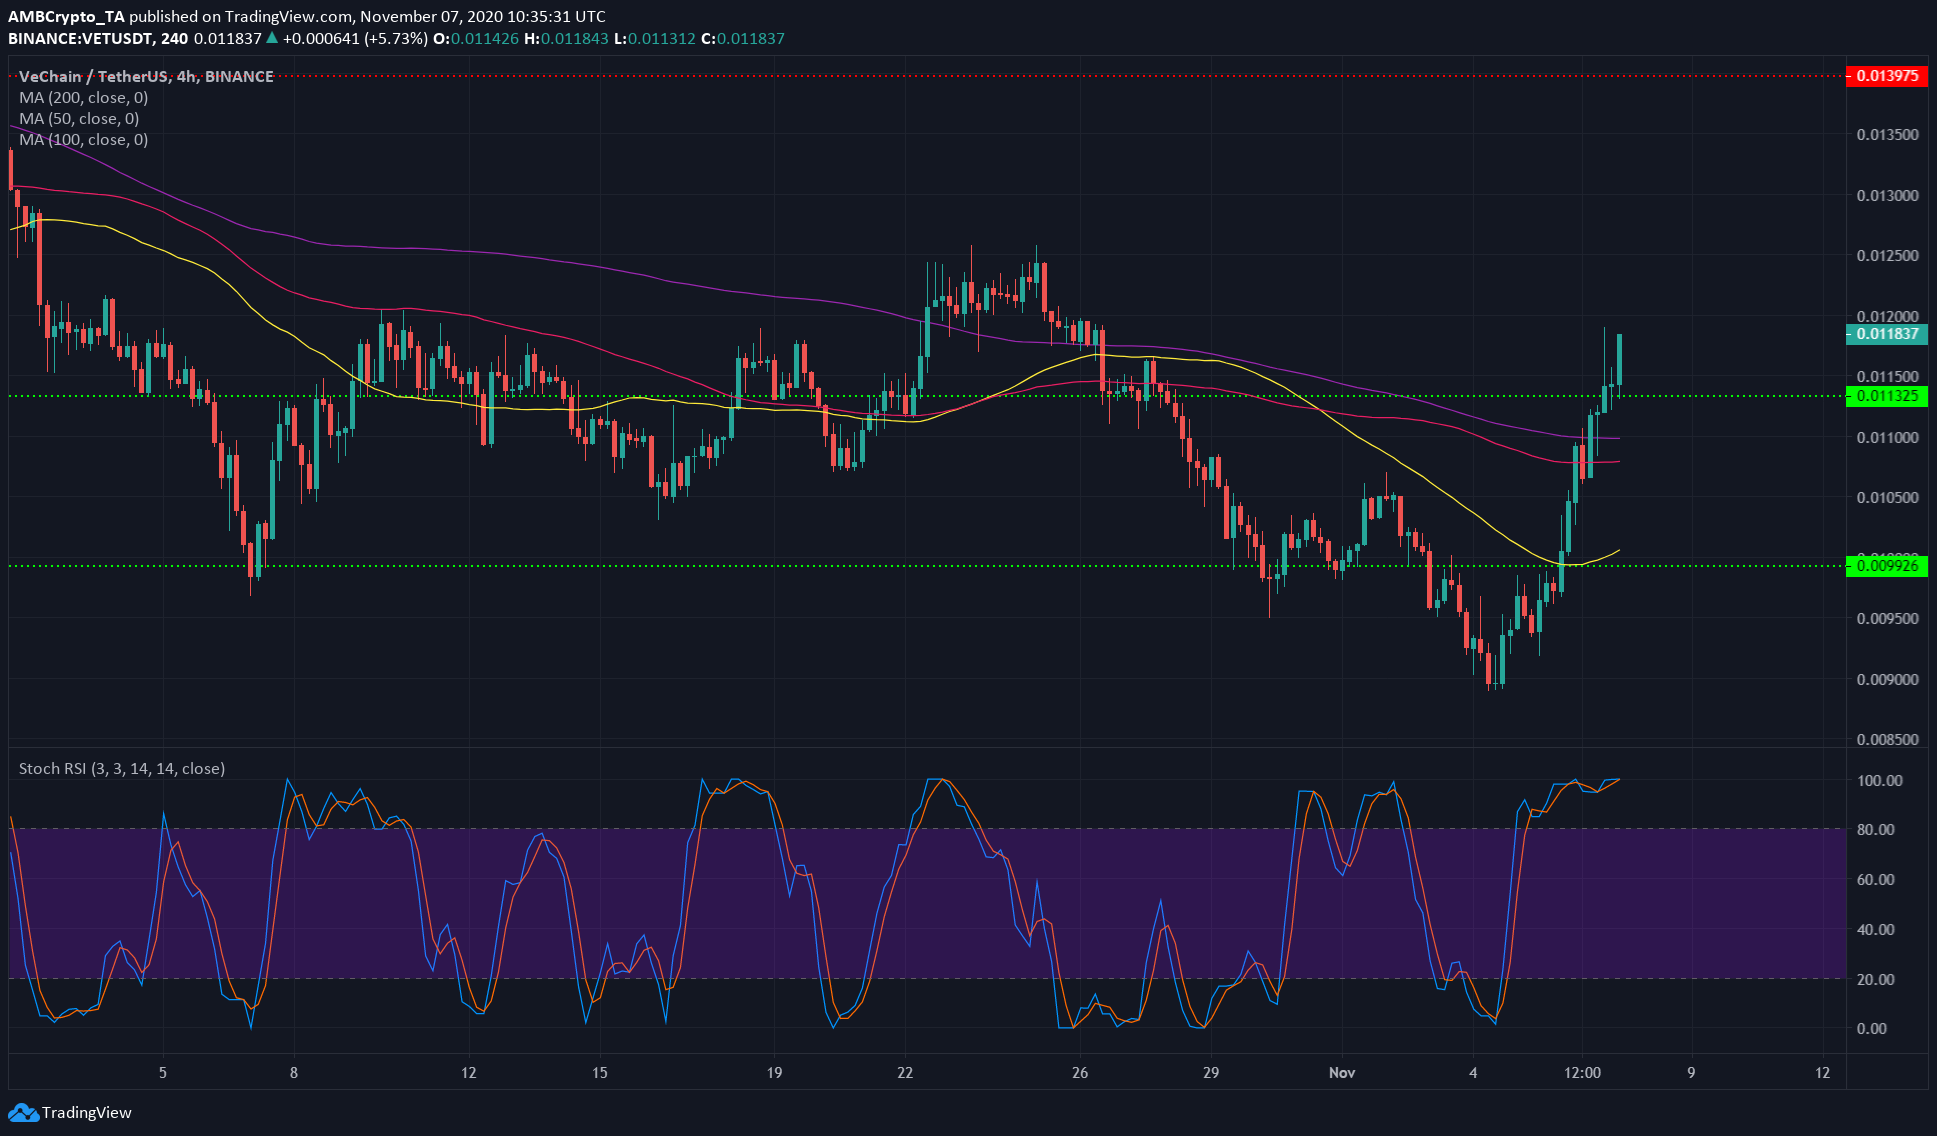
Source: VET/USDT on TradingView
VeChain blew past levels of resistance at $0.009 and $0.01. The Stochastic RSI showed that the crypto-asset was strongly overbought and could be set to experience a minor drop to blow off steam.
The 200 period moving average (purple) was moving above the 100 period moving average (pink), which highlighted that VeChain was seeing considerable losses over the past few weeks.
However, VET’s rise above its longer-term moving averages indicated that a reversal in trend could be in store. Its next level of resistance lies at $0.0124 and $0.014.