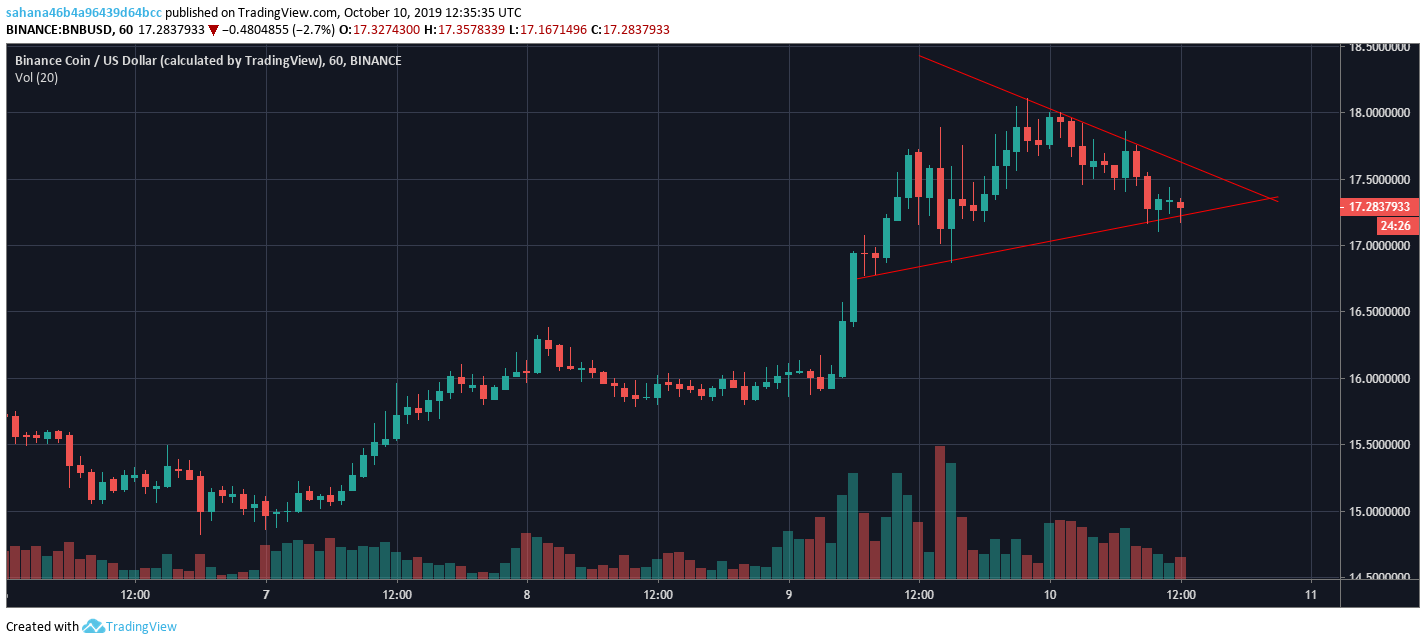
Binance Coin’s symmetrical triangle fuels uncertainty as indicators suggest bearish market

Malta-based cryptocurrency exchange, Binance, is almost always making its way into the crypto-spotlight with several developments in its ecosystem. Just yesterday, the Changpeng Zhao-led exchange launched its P2P trading functionality and enabled Bitcoin, Ether and USDT trading against the Chinese Yuan. This seemed to have spurred the price of the exchange’s native cryptocurrency, BNB, as it was soaring by more than 9%, pushing its price to $17. However, at the time of writing, the eighth largest coin by market cap was recording a 1.22% fall in its price and was valued at $17.21.
Similar to its price change, the short-term charts of BNB also indicated the presence of bears in the market.
1-Hour Price Chart

Source – BNB/USD on TradingView
The one-hour chart for Binance’s BNB formed a continuous trend, further revealing a symmetrical triangle pattern. While one of the trend lines of the pattern formed lower highs at $18.11, $18 and $17.75, the other trend line formed higher lows at $16.75, $16.89 and $17.17. The volume of the coin was seen deteriorating as the triangle extended. The direction of the potential breakout remains uncertain due to the formation of the symmetrical triangle pattern.

Source – BNB/USD on TradingView
The key indicators on the short-term chart for the Binance coin were seen hinting at the presence of the bears. The MACD indicator revealed that the signal line was way above the MACD line, further suggesting a bearish crossover.
The RSI indicator also affirmed a bearish market as the indicator seemed to be headed towards the oversold zone from the overbought zone.
Conclusion
The one-hour chart for Binance’s BNB pointed to a symmetrical triangle pattern, further prompting uncertainty in the direction of the breakout. However, the aforementioned key indicators, MACD and RSI, revealed the presence of bears in the BNB market.


