
Bitcoin showed no signs of stopping its northbound run as it skirted the $19,000-mark over the last few hours. Further down the crypto-ladder, Binance Coin could be set to trade within a range over the next few days while DigiByte formed a rectangle pattern on the charts. Finally, Waves neared its two-year high on the back of a strong bullish surge.
Binance Coin [BNB]
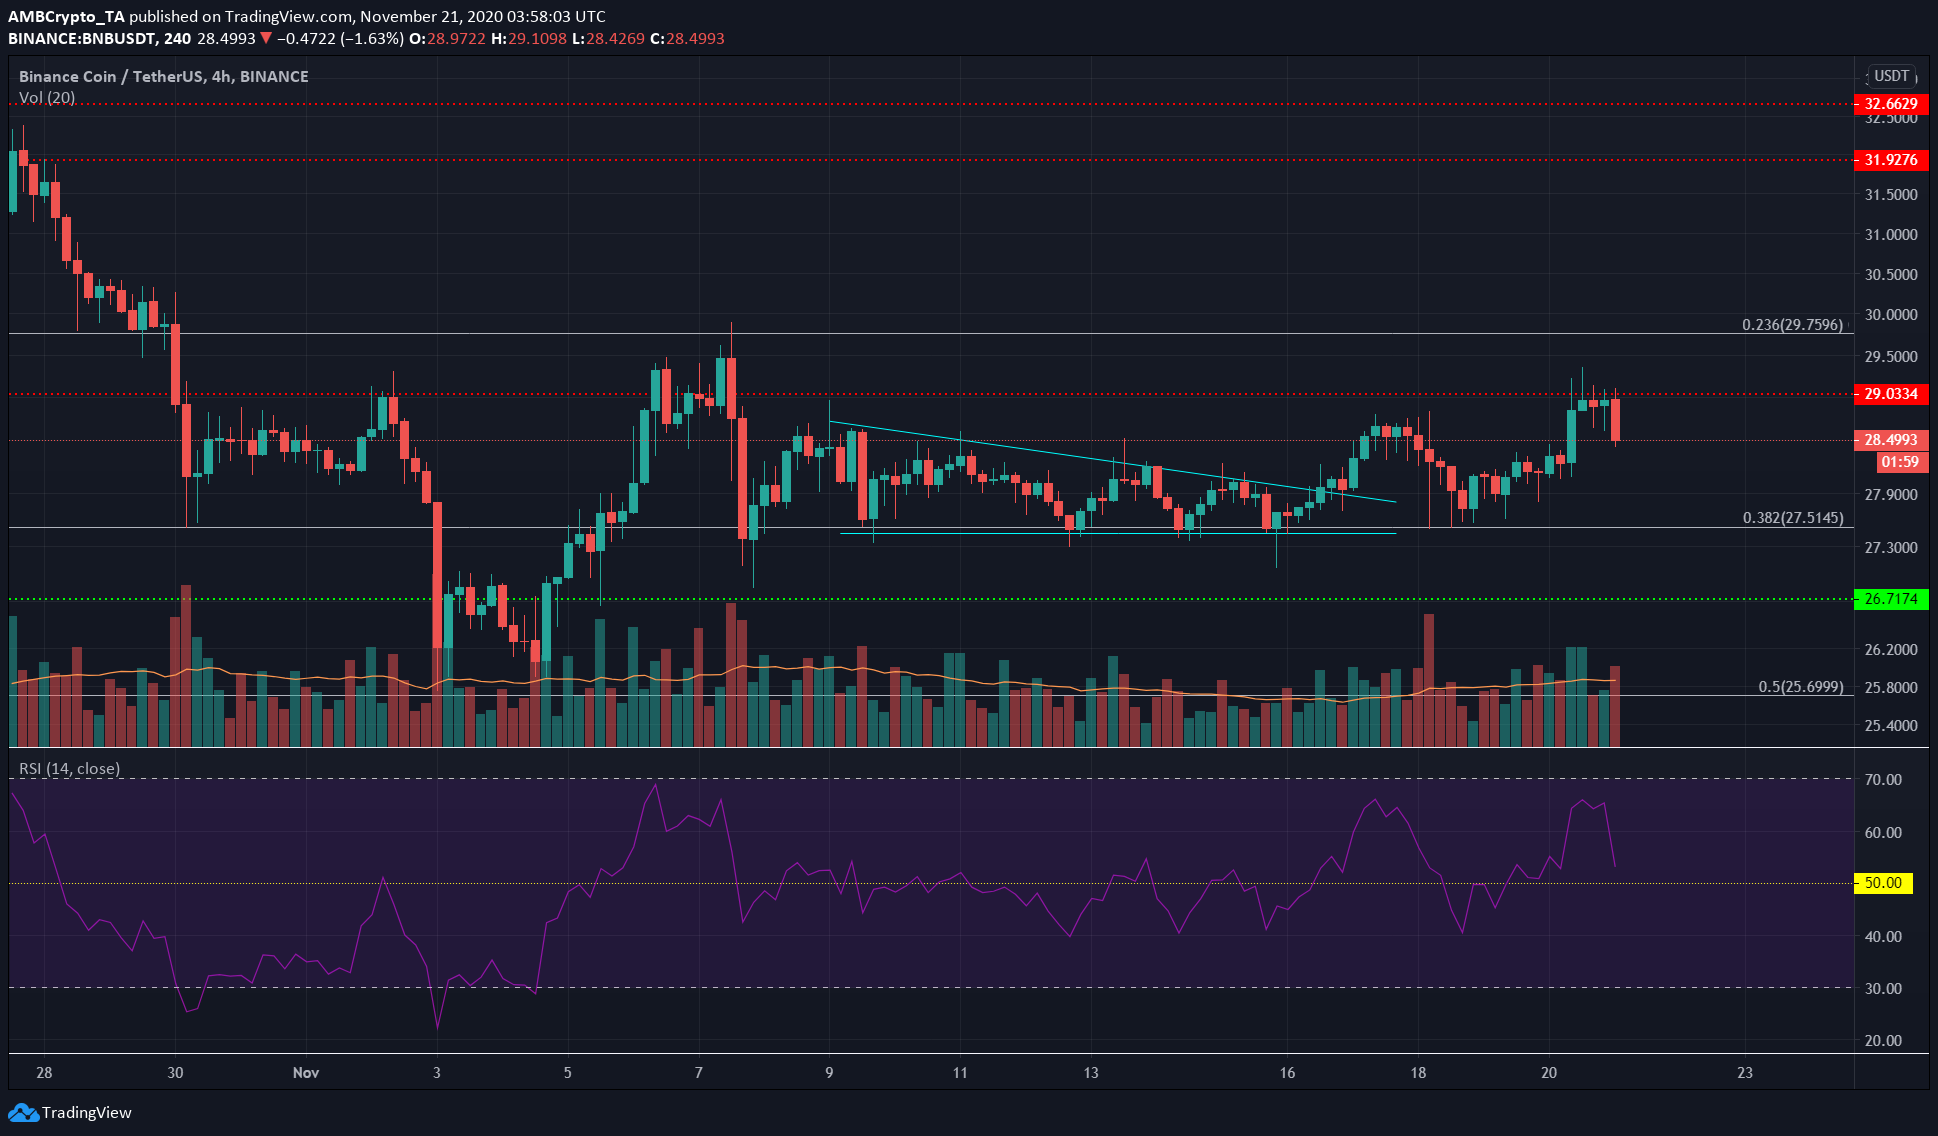
Source: BNB/USDT on TradingView
Binance Coin had formed a descending triangle, having broken out to the upside to test the resistance at $29 over the past few days. However, it was unable to close a trading session above its level of resistance.
The RSI noted bullish momentum while an uptrend was in progress for BNB. Over the next few trading sessions, BNB can be expected to ascend past $29.
A close below $28.3 would indicate that BNB was trading within a range of $27.45 and $29.
Waves [WAVES]
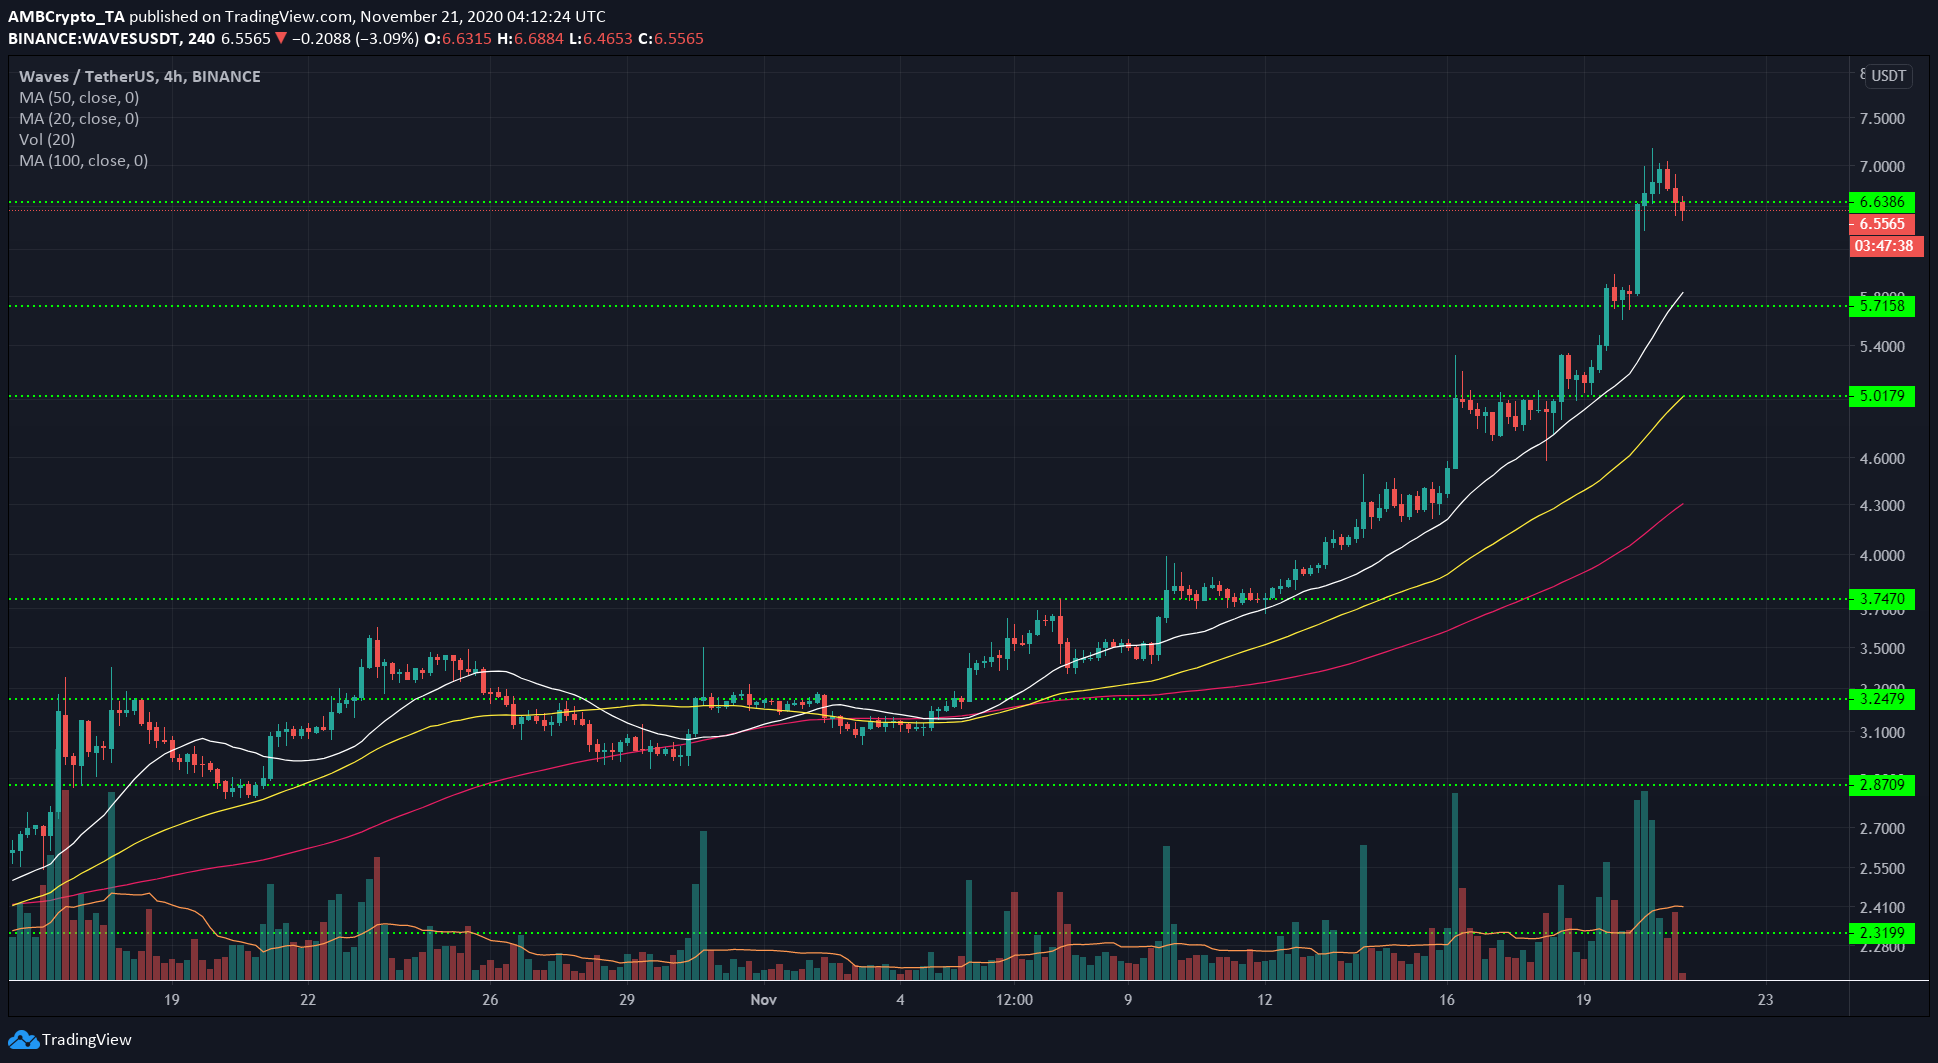
Source: WAVES/USDT on TradingView
WAVES approached its May 2018 high of $7.66 over the previous week. In fact, its price was trading well above its 20 SMA (white), underlining the strong bullish momentum of the past few days.
The slower moving averages also lined up to indicate a strong uptrend and they could act as support if WAVES was to note a pullback.
Finally, the horizontal levels of support for WAVES were at $5.7 and $5.
DigiByte [DGB]
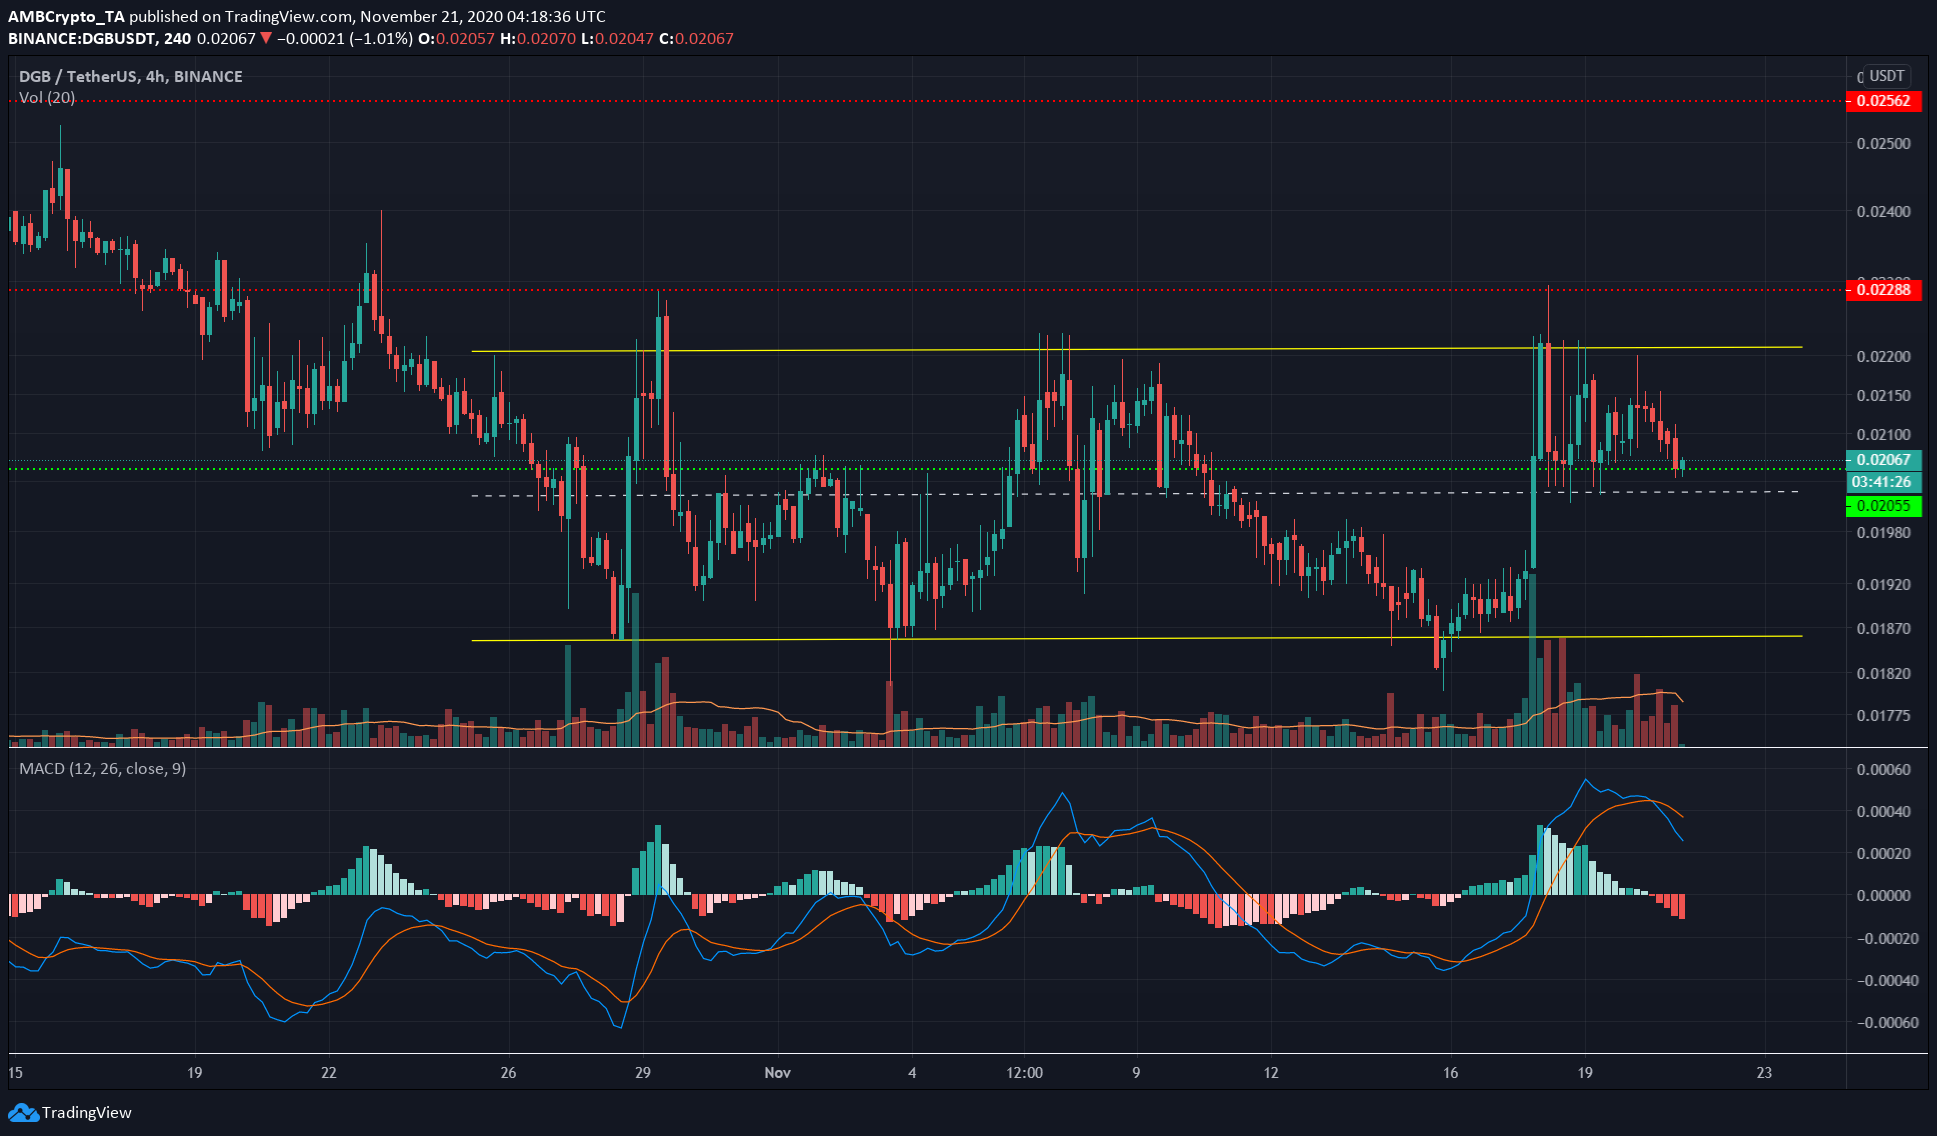
Source: DGB/USDT on TradingView
DigiByte had been in a downtrend from late-September to the beginning of November, and at the time of writing, the price was trading within a rectangle pattern.
The MACD formed a bearish crossover above zero as the price tried to climb past $0.22, the upper boundary of the rectangle. This showed that a pullback to $0.2 or $0.192 could happen soon.
A close below the support at $0.2 could see DGB drop to $0.18 once more.
The rectangular boundaries offered the possibility that DGB might note a reversal in the zone. A close outside the rectangle backed by good trading volume can serve as confirmation for a breakout.