Binance Coin short term price analysis: 10 July

While it’s still not alt-season yet, many altcoins are stealing the shine away from Bitcoin. Looking down the coin ladder several alts catch the eye, and few outdo Binance Coin with its exchange-tethered used cases. The exchange-token of arguably the biggest cryptocurrency exchange in the market, BNB had a bittersweet 2019, While the first half of the year took it from $4.5 to over $34, it ended the previous year at almost half its 2019 ATH price, and 2020 is not going very well.
In March 2020, prior to the crash, BNB was trading over $26 a pop, and at the end of March it was below $13. However, that’s not to say it hasn’t had a resurgence. In Q2 2020, BNB’s price increased by 25 percent, and at press time it’s trading at $16.62, almost double its March price.
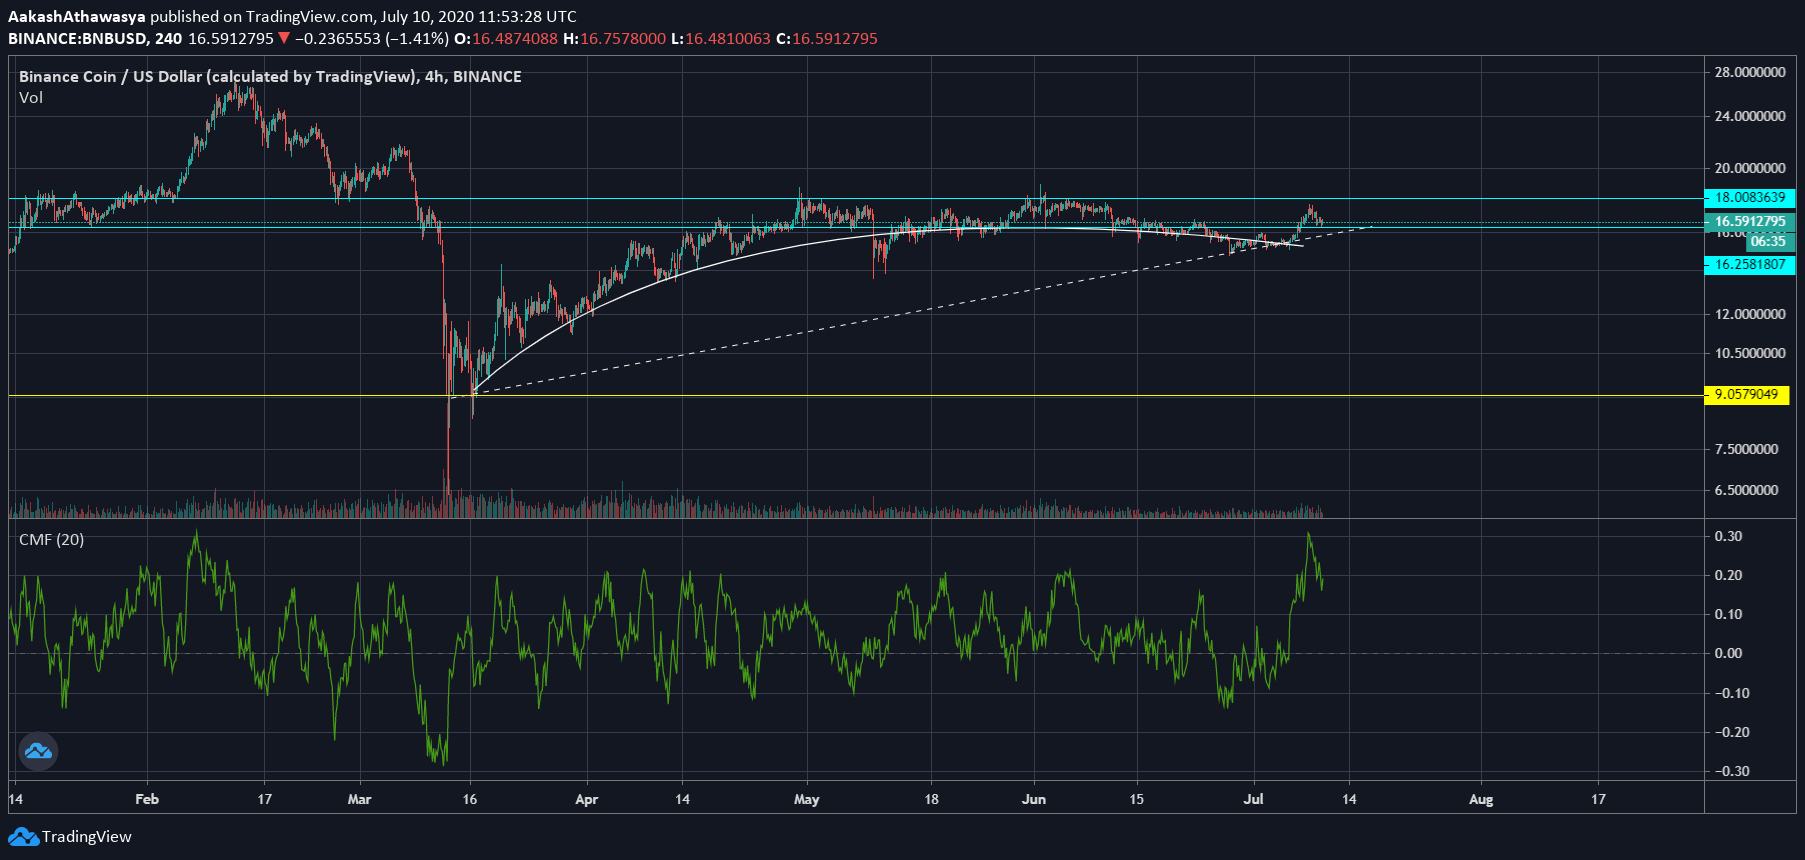
Looking at the 4-hour price chart of the cryptocurrency, there is a clear eclipse forming as a result of the price hitting a constant resistance level at $18. On two occasions, each lasting a few days, did the altcoin tussle with the level without a prolonged break over. The first was at the beginning of May up until the Bitcoin halving, and the next was between 29 May to 11 June, when it traded in a channel between $16.8 – $18.

Source: BNBUSD via Trading View
The area under the curve and over the trend line was entered just once for a period of 12 hours immediately prior to the halving, and at the end of June. During the latter, once the eclipse coincided with the trend line there was breakout pushing the price from $15.3 to as high as $17.52. Despite coming close to the $18 resistance, the price turned down at $17.52 and has been decreasing since earlier this week.
As far as the money supply for Binance Coin goes, it has been dropping since 8 July. As things stand the Chaikin Money Flow tool is at 0.19, down from over 0.3 a few days ago, and is indicating a removal of money from BNB tokens, but since it is over 0, there are healthy signs for the altcoin
While the $18 resistance level is important for the altcoin, the key support level lies at $16.25, which is the highest point of the eclipse touching the price candles. A dip below this [as is likely] will then cause the price to move close to the disjointed trendline at price $15.72, where the price is likely to rebound. This rebound will only materialize if the steady volume is present, owing to a decent inflow of money as indicated by the CMF increasing, or holding strong above 0.


