
The trading charts for the altcoin market was once again displaying bearishness after a shift from the recent upward rallies gained just last week.
Binance Coin with its double top formation was seen heading towards a bearish scenario. The bear market for IOTA, however, might still display some hope. In the case of FTX token, the situation was still grueling, with most technical indicators hinting towards the possibility of the downtrend to continue for the next 24 hours.
Binance Coin [BNB]
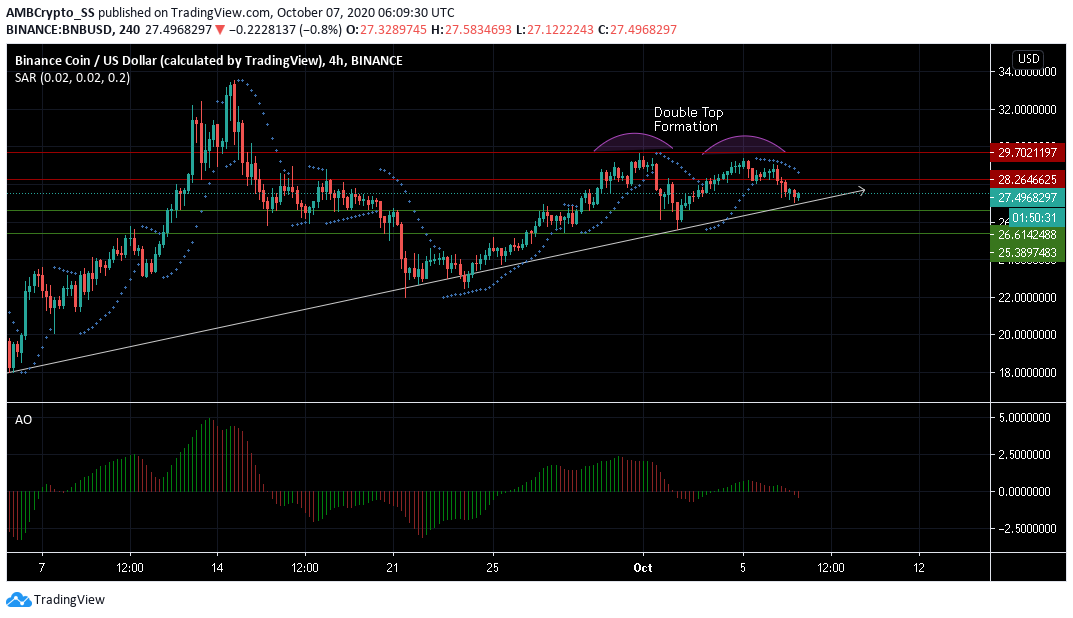
Source: BNB/USD on TradingView
Over the weekend BNB surged towards the $29.70 level resistance and subsequently faced rejection that saw it slump back down to its immediate support level. This led to the digital asset displaying a double top formation, with the two consecutive highs seen on the chart, signaling an extremely bearish technical reversal pattern that could lead to a possible price correction.
The dotted lines of the Parabolic SAR above the candles hinted at a downward price trend for the upcoming trading sessions.
The Awesome Oscillator too was seen making a bearish crossover below the zero line, signaling a rise in selling pressure.
IOTA
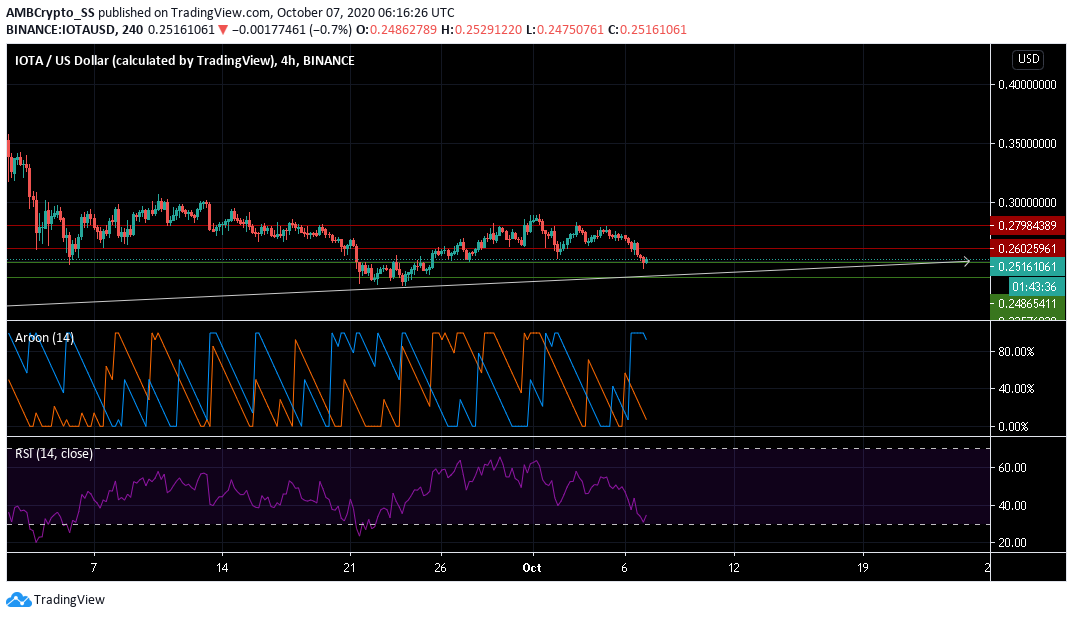
Source: IOTA/USD on TradingView
For IOTA, the downward price momentum was captured clearly by the Aroon Indicator with a bearish crossover visible as the Aroon Down (Blue) rose above the Aroon Up (orange).
The digital asset, however, benefits from a strong support level at $ 0.235, and the existence of a sort of descending channel over the last few days was indicative of a possible trend reversal from bearish to bullish, that could see the prices rising back up from the $0.235 mark.
The Relative Strength Index too was also fairly close to completion of its downward cycle near the oversold territory and might see a jump back from these levels.
Immediately, however, there still remains scope for a further downtrend as noted by the technical indicators. But in the short-medium term, a trend reversal has a good probability of occurrence, with prices moving back up towards the $ 0.26 resistance level.
FTX Token [FTT]
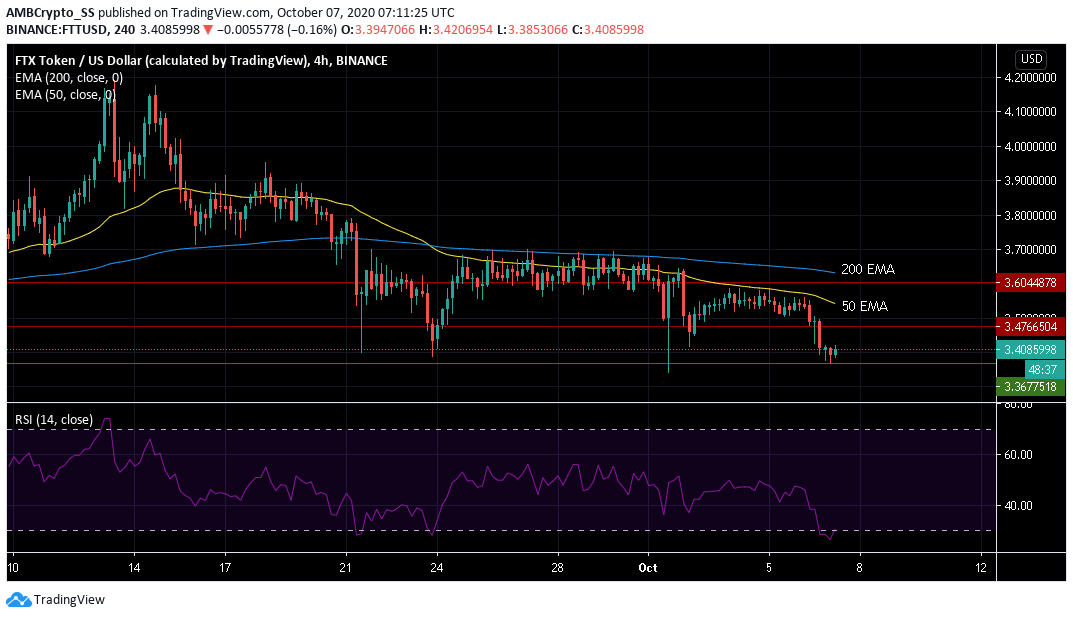
Source: FTT/USD on TradingView
The recent sell-off in FTX token has been significant, the digital asset remained in an even more bearish scenario compared to the end of September. FTT at press time traded at $ 3.408.
The 50-day exponential moving average since 24 September has been below the 200 EMA, with the gap only expanding between the two, highlighting an extremely bearish scenario.
The Relative Strength Index too remained in the oversold territory, also indicative of continued selling pressure; the next few trading sessions are likely to be on the downside as the bears march on.