
The price drops observed recently by many of the market’s altcoins hinted at a bearish phase over the coming weekend. Binance Coin’s technical indicators were giving early sell signals, with BNB seemingly primed for a price action down the charts. Further down the crypto-ladder, NEM and Augur too were likely to register growing selling pressure, with the cryptocurrencies continuing to lose crucial support levels.
Binance Coin [BNB]
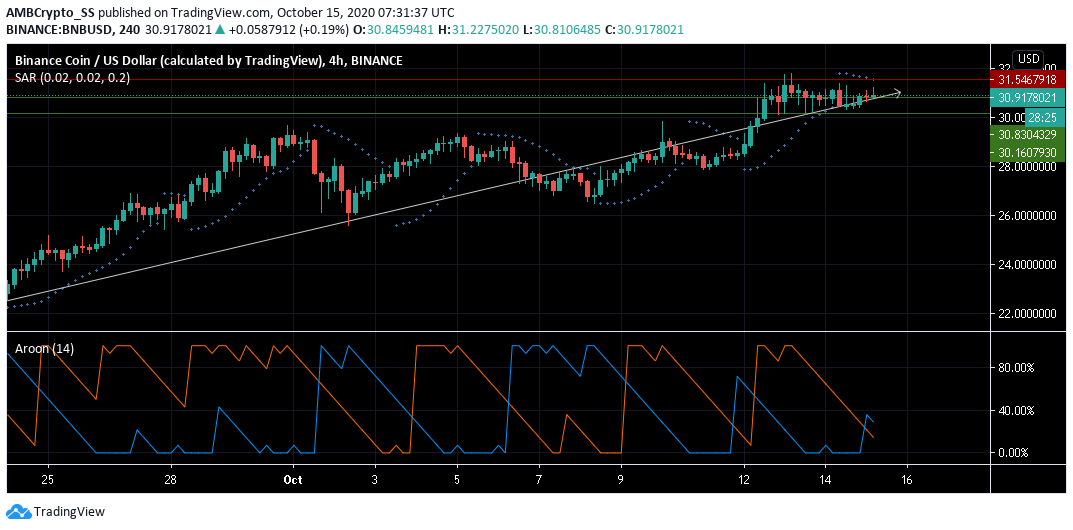
Source: BNB/USD on TradingView
The Aroon Indicator for Binance Coin was slightly bearish as the Aroon Down (blue) had started to cross above the Aroon Up (orange). However, the aforementioned bearish strength was still too weak to initiate a major sell-off.
At press time, BNB’s price was seen alongside its immediate support level at $30.830, following a bounce above the previous support at $30.160.
While the overall trend for BNB remains positive, southbound price action seemed imminent, with the same underlined by the Parabolic SAR’s dotted markers being found above the price candles.
The minor price correction on the charts could be a consequence of the market-wide bearishness. It offered a buy on dip opportunity for traders, giving the digital asset an opportunity for strong price recovery.
Augur [REP]
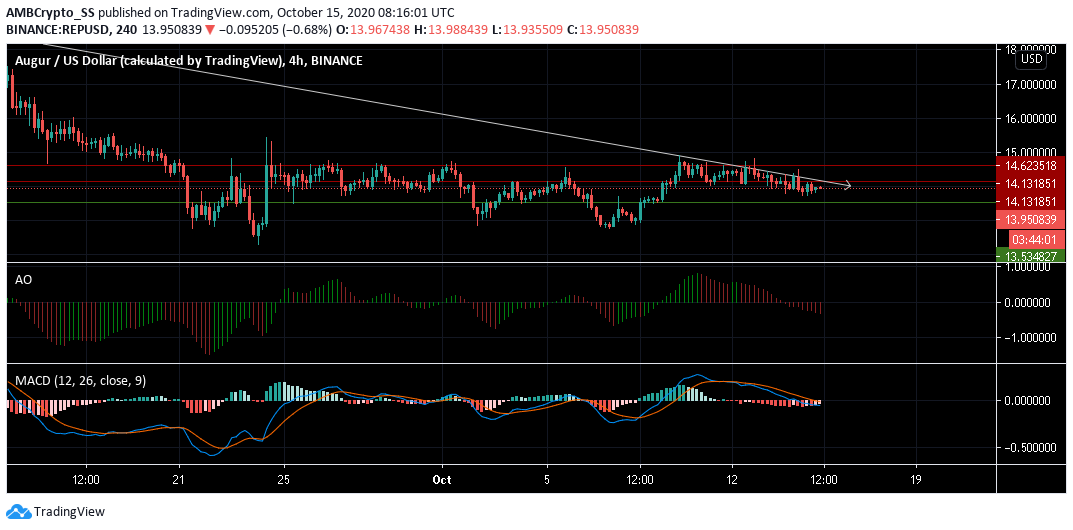
Source: REP/USD on TradingView
Despite rallying from $12.67 to $14.9 over the last one week, Augur failed to sustain its momentum. Losing control at two key resistance levels, the digital asset fell back towards the $ 13.53-level of support.
The MACD, with its bearish crossover, further confirmed the bearish scenario. The Awesome oscillator was also signaling short-term bearishness as it dived below zero on the charts.
Low volumes over the coming weekend could stall further selling pressure. However, a drop below the immediate support level at $13.53 could also be witnessed.
NEM [XEM]
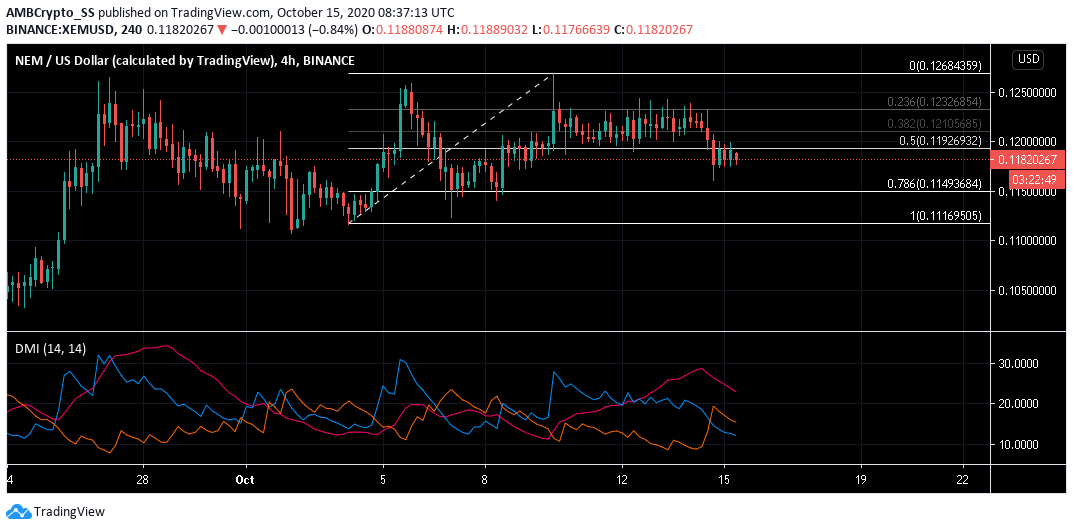
Source: XEM/USD on TradingView
At the time of writing, a bearish trend for NEM was picked up by its Directional Movement Index. The -DMI (orange) was lying above the +DMI. The digital asset was also down by a percent since yesterday.
Furthermore, dropping below the 50% retracement region marked by the Fibonacci retracement tool, clear selling sentiment for the XEM token was visible.
A drop to the 78.6% level or the $ 0.114-support remains a likely scenario over the next few days.
In related developments, NEM on Twitter recently announced a partnership with ‘hummingbot_io’ as its next step into DeFi. The collaboration aims to strengthen the NEM network and increase accessibility to the XEM token.