
Over the past few weeks, the attention received by the Bitcoin halving has blacked out all the white noise in the industry. In fact, not a lot of importance was given to any other unfolding trend as most people anticipated price actions up until the event. The collapse on 10 May was the last bit of volatility before the 3rd halving took place, and now the bullish rally is possibly over for a while.
However, a major difference was observed on the charts and the same was highlighted between the market’s two largest digital assets.
Bitcoin and Ethereum have registered a peculiar correlation since the start of 2020. Constantly converging and diverging in terms of price mediation, recent data from the Skew analysis suggests that ETH-BTC 3-month implied volatility spread registered a new yearly low, one that was last witnessed in November 2019.

Source: Skew
After a high of 27 percent on 23 February, the levels were found to be as low as 7.2 percent on the 12 May. The declining implied volatility indicated that the correlation between Ethereum and Bitcoin had become stronger since the start of the month, a finding that may have huge implications if there is another bearish pullback for Bitcoin.

Source: Skew
However, the major catch was the fact that ETH-BTC’s realized correlation has been dropping since the start of April, a finding that suggested a completely opposite scenario for both the crypto-assets.
Impact of Bitcoin’s last 15% collapse
It can be speculated that Bitcoin’s last decline may have shaken up the Implied Volatility levels. On 10 May, after consolidating for 48 hours near the range of $10,000, Bitcoin’s slid all the way down to $8300 within 24-hours.
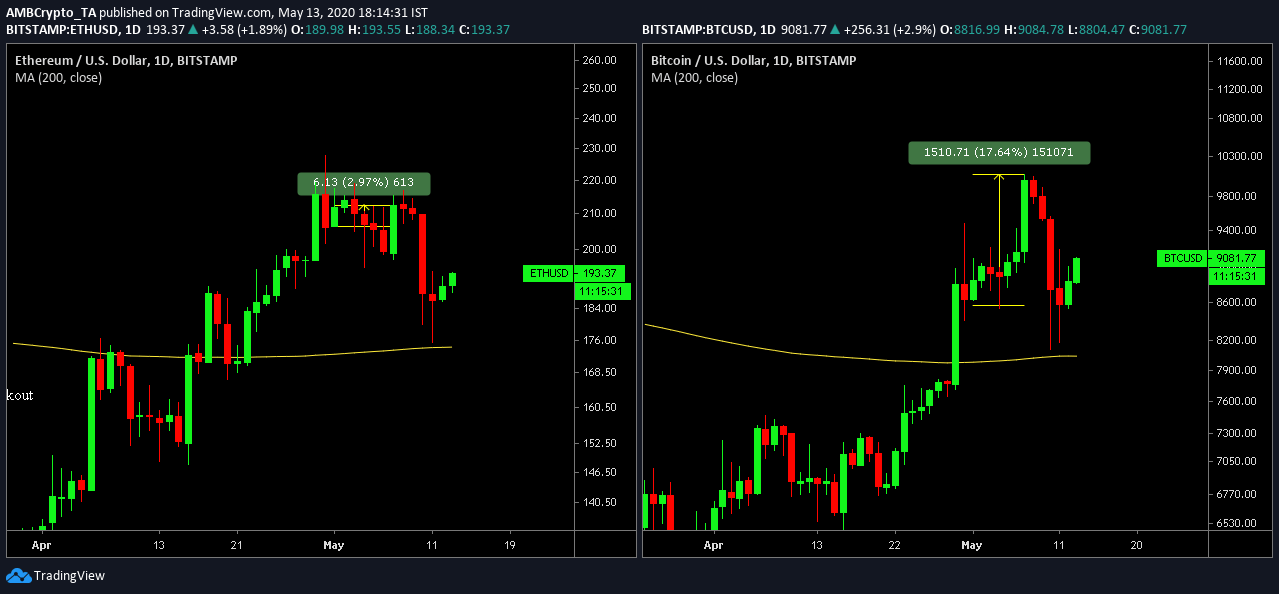
Source: Trading View
However, the growth registered by Bitcoin from 1 May to 10 Mat was still an impressive rally of 17.64 percent. At the same time, Ethereum hiked by only 2.97 percent. Hence, it is plausible that Bitcoin’s recent dip brought the world’s largest crypto-asset back to the long-term growth levels of Ethereum, and therefore, the drop in Implied Volatility levels was identified.
ETH 2.0 may potentially spike ETH-BTC IV levels
In hindsight, this situation may likely change over the next couple of months as well. ETH 2.0 phase zero is set to launch in July 2020, and the recent traffic witnessed by Ethereum’s network has been largely cohesive. As previously reported, Ethereum registered a record number of validators during last month’s testnet launch and currently, ETH’s network accrues a 93 percent network utilization.
It will be ignorant to state that the launch will not have an indirect effect on Ethereum’s price as Bitcoin may undergo a severe consolidation phase now. Taking nothing away from the current correlation, it will be important to keep an eye on the metric over the next couple of weeks in May.