Bitcoin: Can the $47K price prediction come true soon

- Bitcoin has rallied by more than 13% in the last seven days.
- Selling pressure on the king coin increased.
After a long wait, Bitcoin [BTC] finally managed to go above $40,000 for the first time since April. This news sparked excitement in the crypto community.
Not only does this episode reflect BTC’s potential, but it also caused the coin to make an earlier resistance level to its new support.
Bitcoin finally goes above $40,000
Though BTC exhibited a bull rally a few weeks ago too, it failed to amaze investors. But things changed in the recent past as its value went above $40,000.
According to CoinMarketCap, BTC was up by more than 13% in just the last seven days. At the time of writing, it was trading at $41,709.36 with a market capitalization of over $815 billion.
Its trading volume also surged in the last 24 hours, acting as a foundation for the price hike. Thanks to the recent bull rally, BTC’s market dominance also surged.
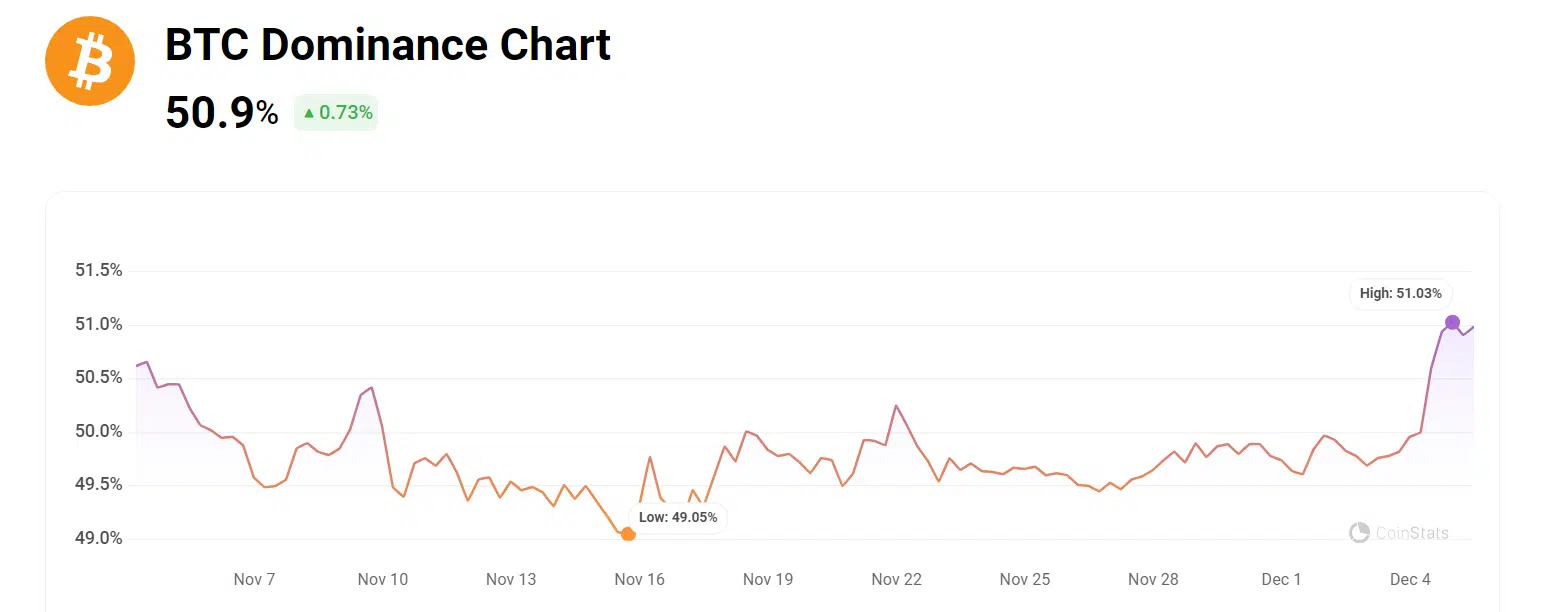
When AMBCrypto checked Coinstats’ data, we found that BTC’s dominance reached 51.03% at press time. The same figure plummeted to 49.1% in November 2023.
Bitcoin: New key levels to look at
While BTC’s price rallied, crypto analyst Ali pointed out a few key levels for the king coin via X (formerly Twitter). Notably, the most important resistance area for BTC was at $47,360.
Thus, BTC’s new support level can be expected somewhere near the $37,000 mark.
#Bitcoin | The most important resistance area for $BTC is at $47,360, while $37,000 has now become a significant support zone! pic.twitter.com/0OpN2ZMo9e
— Ali (@ali_charts) December 4, 2023
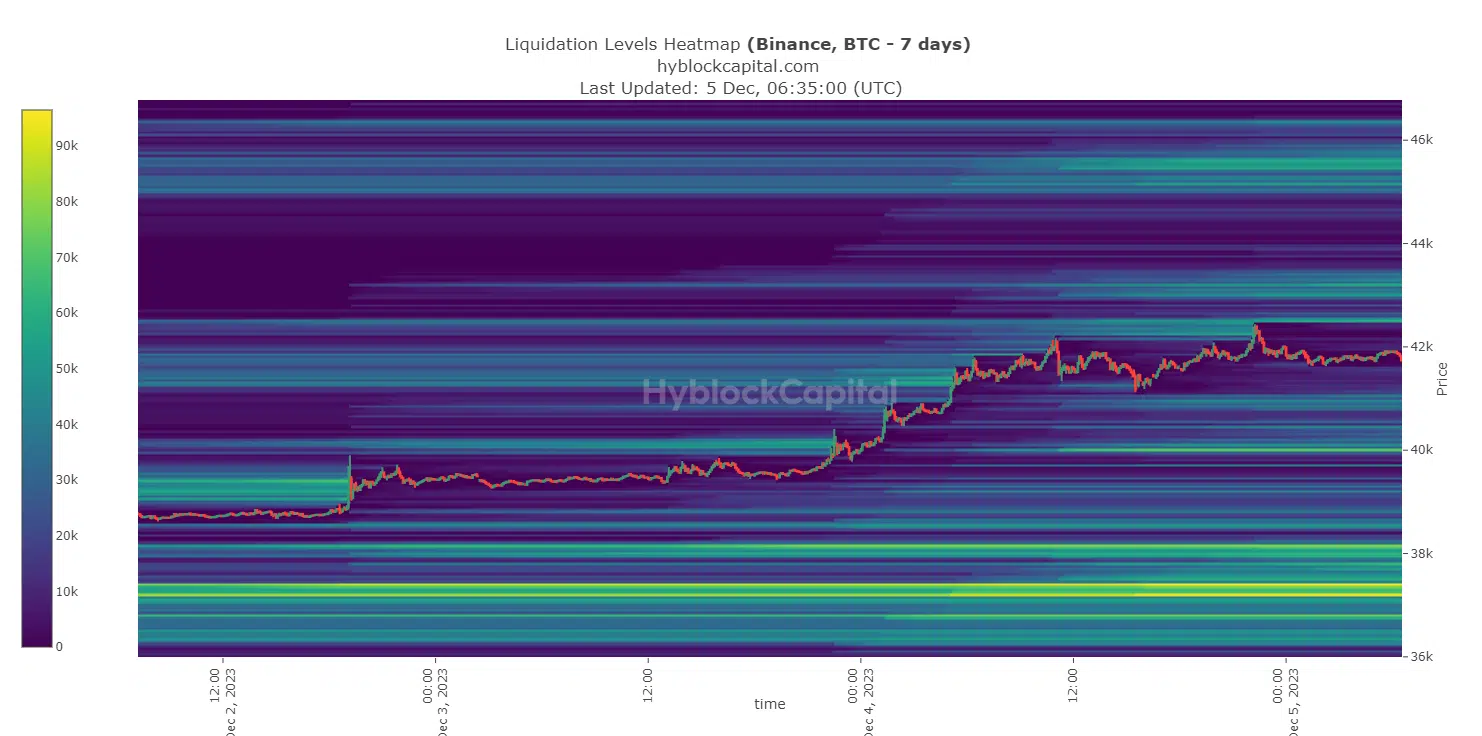
AMBCrypto then took a look at Bitcoin’s liquidation levels to affirm the above thesis. We found that BTC’s liquidation increased considerably, near $37,000 (fluorescent lines).
Therefore, the possibility of $37,000 being BTC’s new support seemed high. Moreover, as evident from Hyblock Capital’s data, BTC’s price failed to go above the $42,500 mark.
Therefore, the king of cryptos must first surpass that mark to continue its bull rally.
Will BTC cross $42,500 soon?
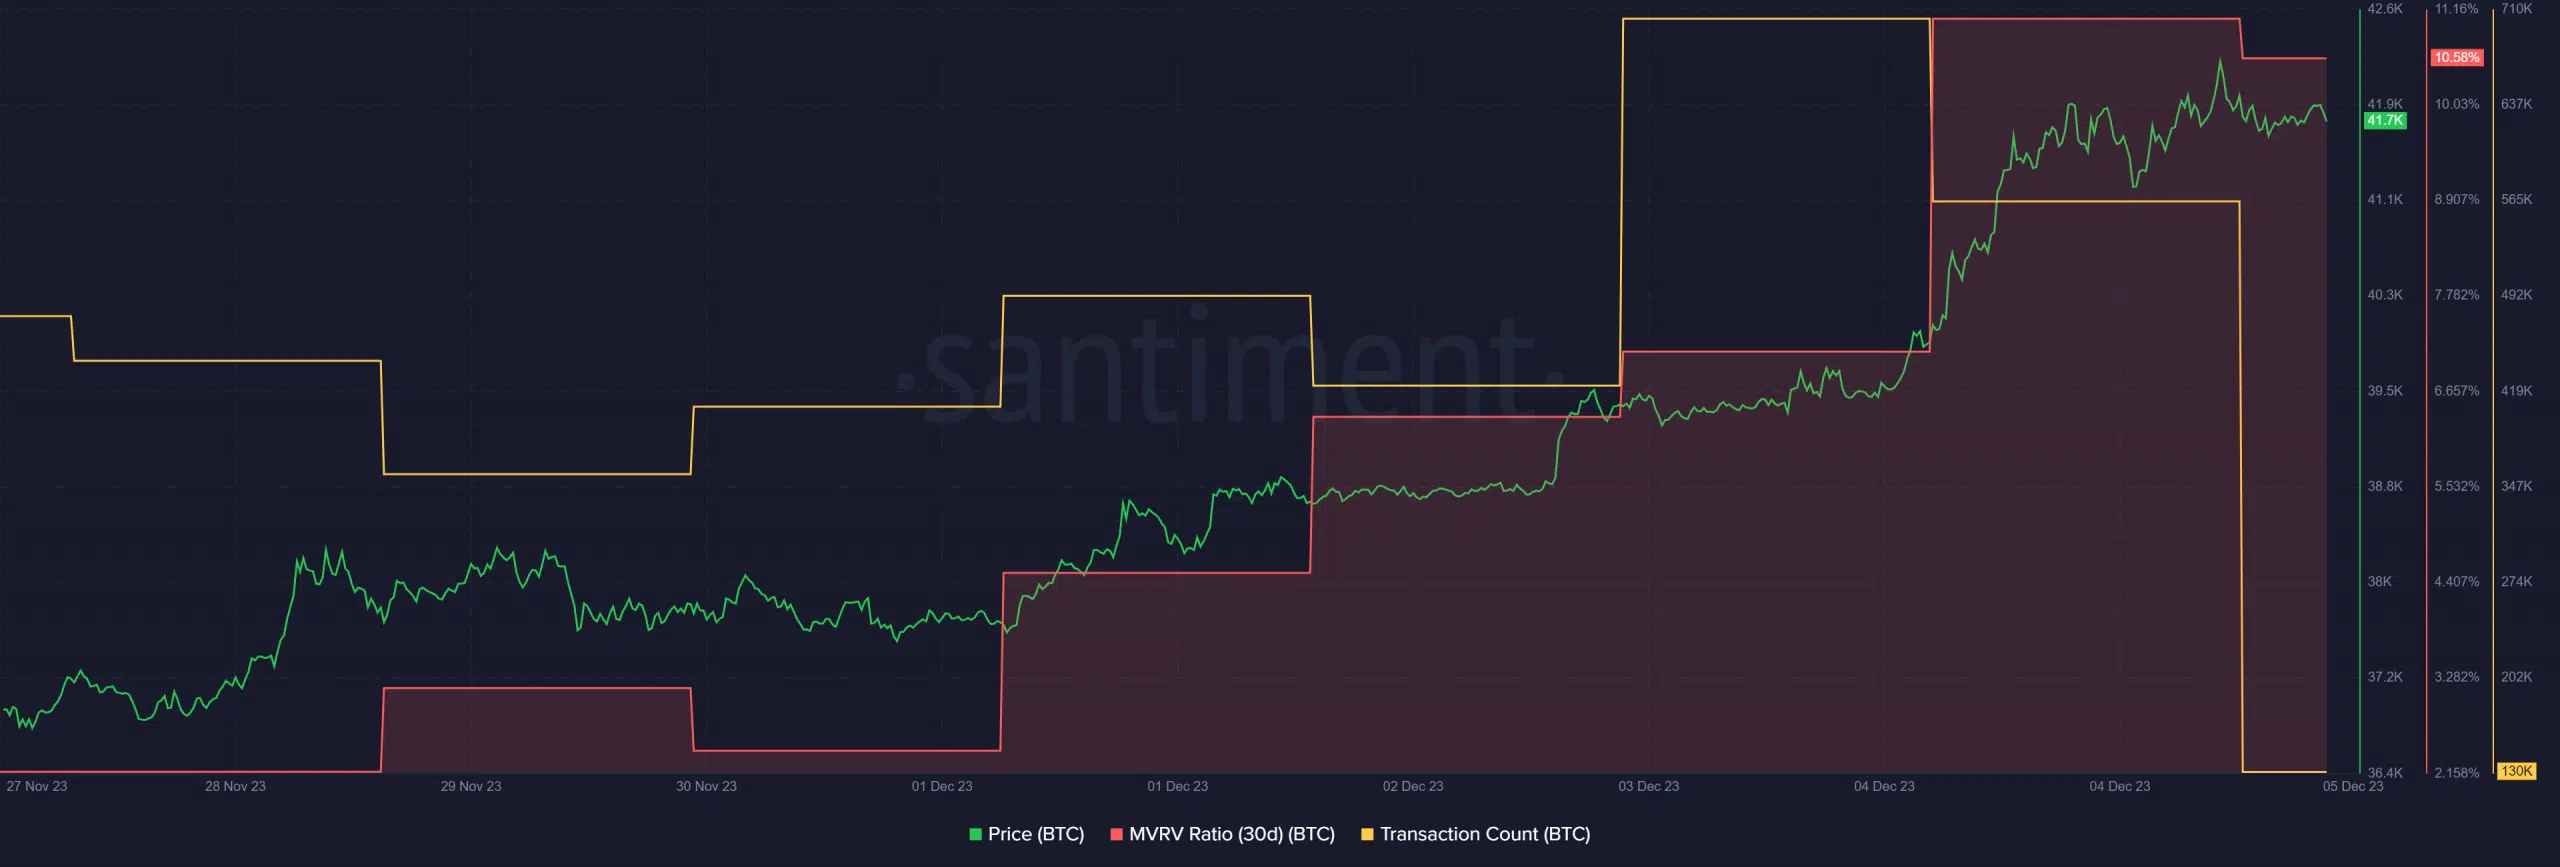
AMBCrypto then had a look at the king of crypto’s on-chain metrics to see the viability of BTC crossing $42,500. The coin’s MVRV ratio increased substantially over the last week, which was a positive signal.
Another positive metric was its Transaction Count, which rose in the last week as well.
Additionally, CryptoQuant’s data revealed that BTC’s Binary CDD was in the green at press time. This meant that long-term holders’ movements in the last seven days were lower than average.
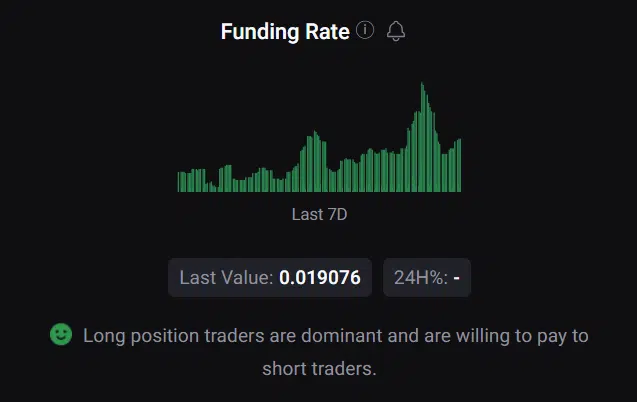
Derivatives investors were also buying BTC at its higher price, increasing the chances of a continued price hike.
However, despite the recent hike in the coin’s price, BTC miners made a different choice. Miners have always played a major role in shaping BTC’s price action, and in this instance, they had started to sell.
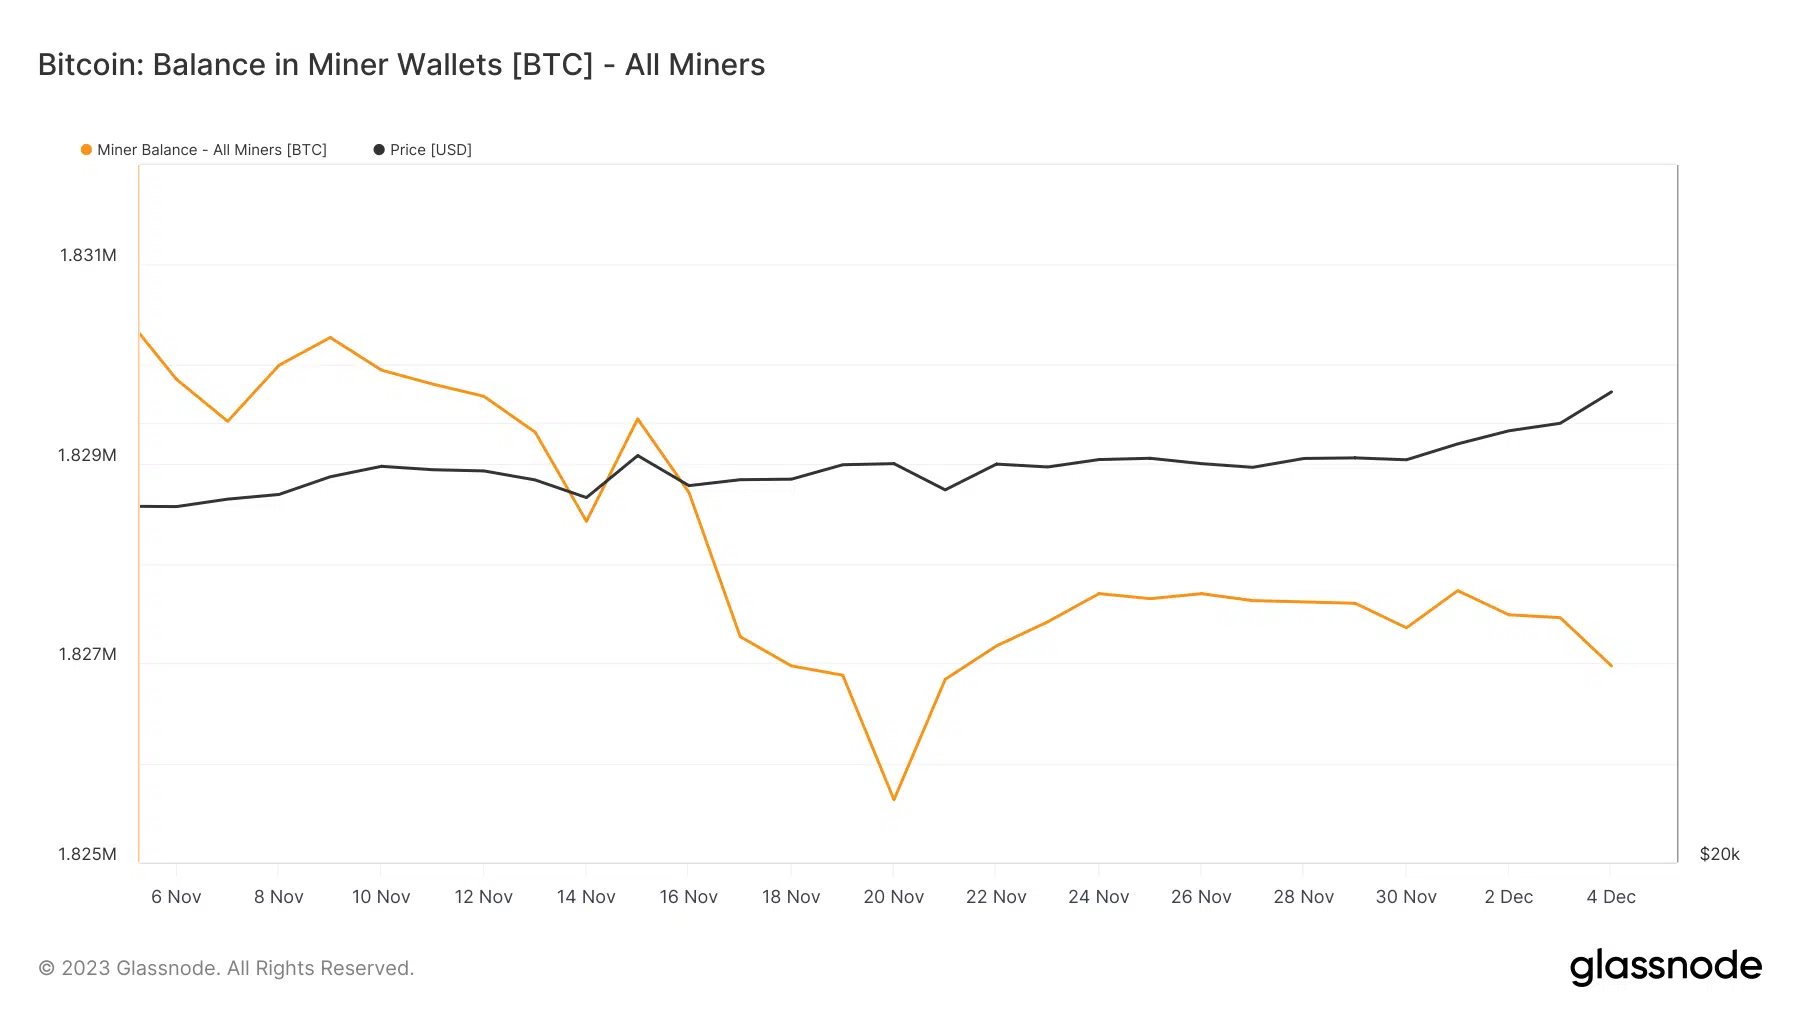
AMBCrypto’s check on Glassnode’s data revealed that the Balance in Miner Wallets had been declining for more than a month. At press time, miners’ balance stood at 1.8 million BTC.
Moreover, miners were selling holdings in a moderate range compared to their one-year average, which was evident from the Miners Position Index (MPI).
Since miners were selling, it was imperative to look at the broader market to understand the sentiment around BTC.
As per data analyzed by AMBCrypto via CryptoQuant, BTC’s net deposits on exchanges were high compared to the last seven-day average, meaning that selling pressure on the coin was high.
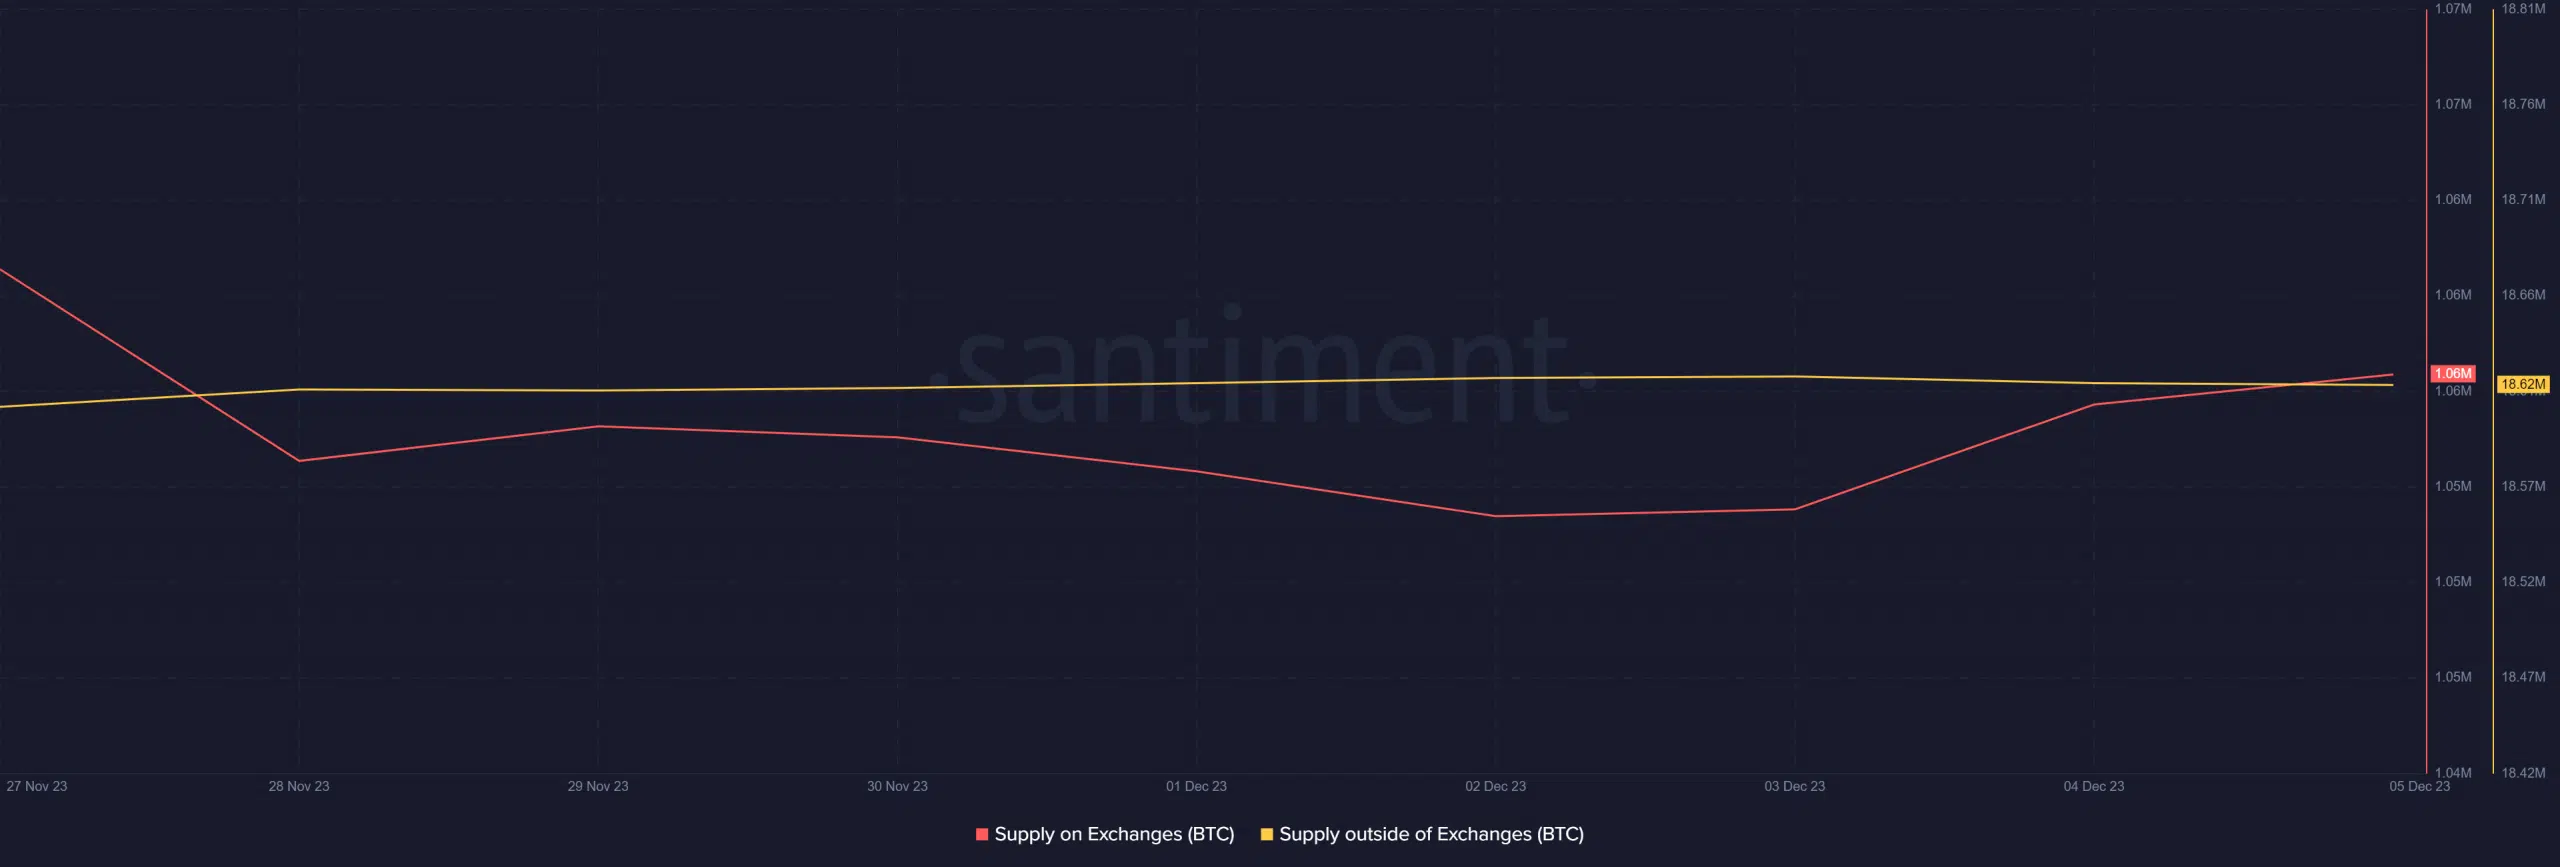
Worryingly, Bitcoin’s Supply on Exchanges recently flipped its Supply outside of Exchanges. This meant that investors were selling BTC when its price was high to exit with a profit.
Should investors expect a price drop?
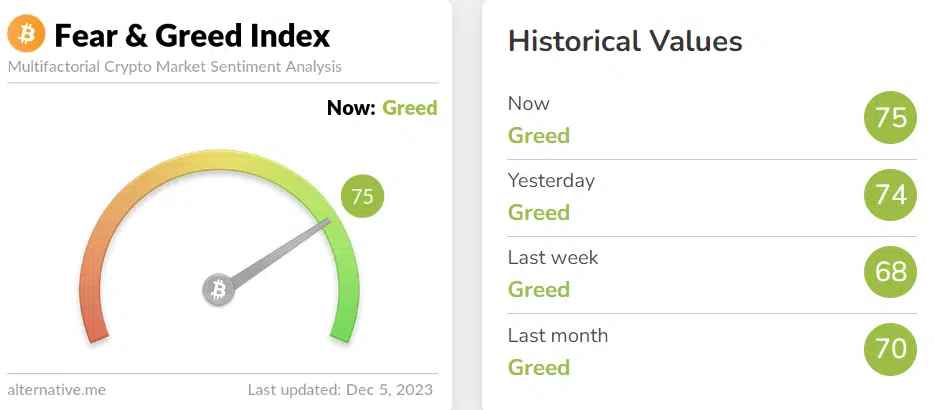
Apart from Bitcoin’s supply on exchanges, another bearish metric was the coin’s fear and greed index. At press time, the index had a value of 75, indicating “greed” in the market.
Whenever the index reaches the greed position, the probability of a price correction becomes likely.
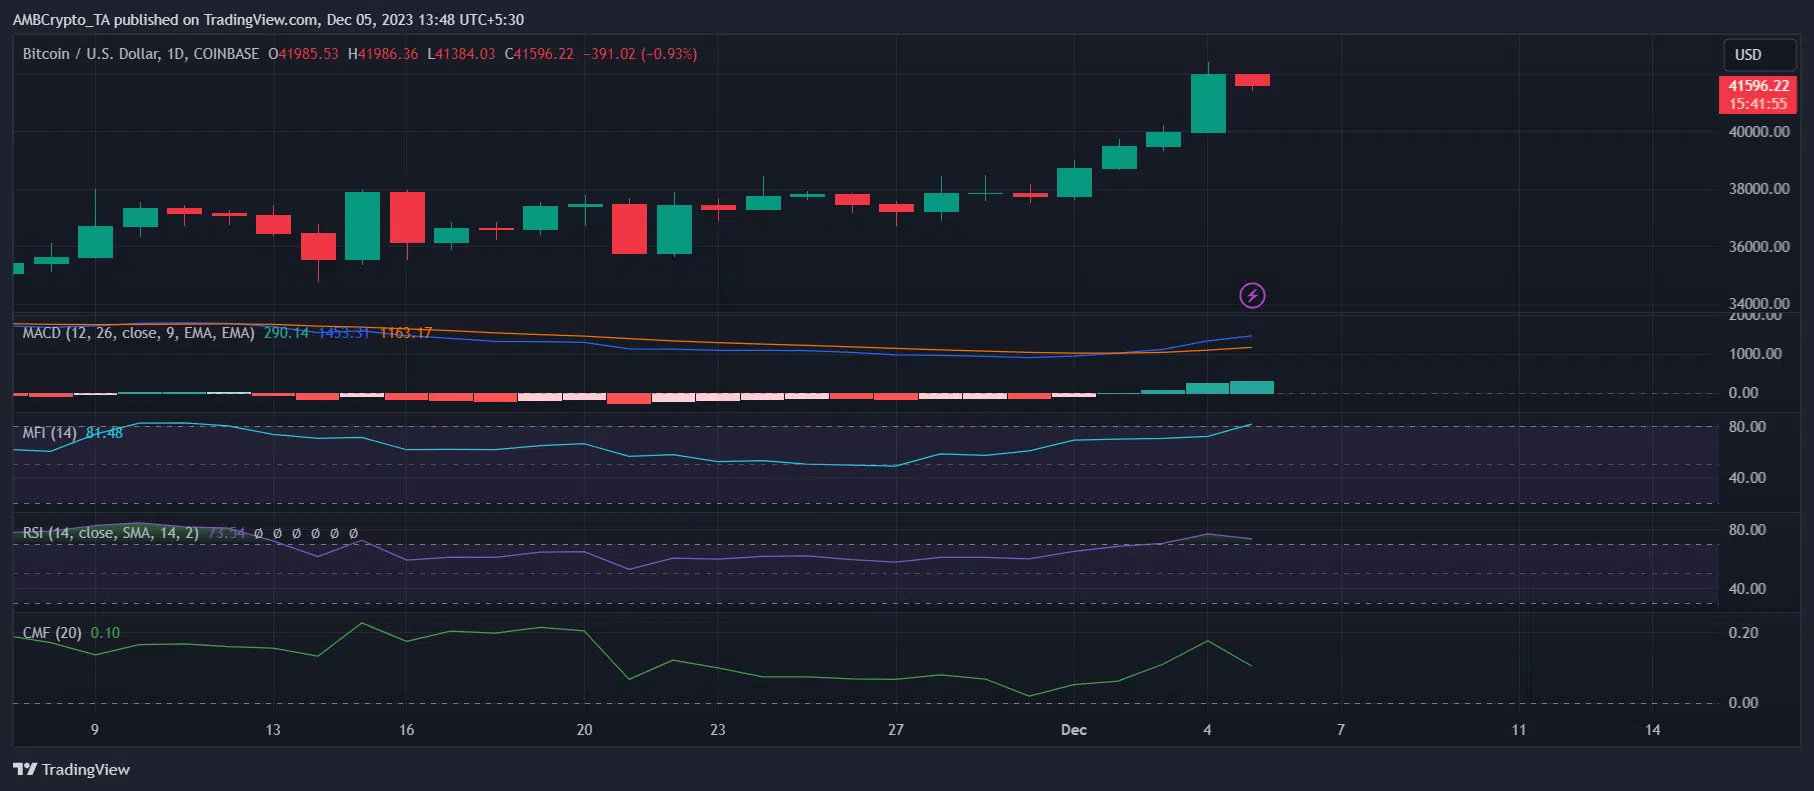
Therefore, AMBCrypto checked BTC’s daily chart to better understand whether BTC will go down to $37,000 and test its support level in the coming days.
BTC’s Chaikin Money Flow (CMF) registered a sharp decline, which was a development in the sellers’ favor.
Read Bitcoin’s [BTC] Price Prediction 2023-24
Additionally, both Bitcoin’s Money Flow Index (MFI) and Relative Strength Index (RSI) were in overbought zones, increasing the chance of a price drop.
Nonetheless, the MACD remained in the buyers’ favor as it displayed a bullish advantage in the market.

