Litecoin short-term Price Analysis: 3 October

The Bitcoin market has been leading the altcoins trend for the longest time, but currently, some alts have been at a deciding junction. Litecoin [LTC] was one such alts at an indecisive position.
The current price of LTC was at $52.67 and it can be an interesting point for both short-position and long-position.
Litecoin 1-hour chart

Source: LTC/USD on TradingView
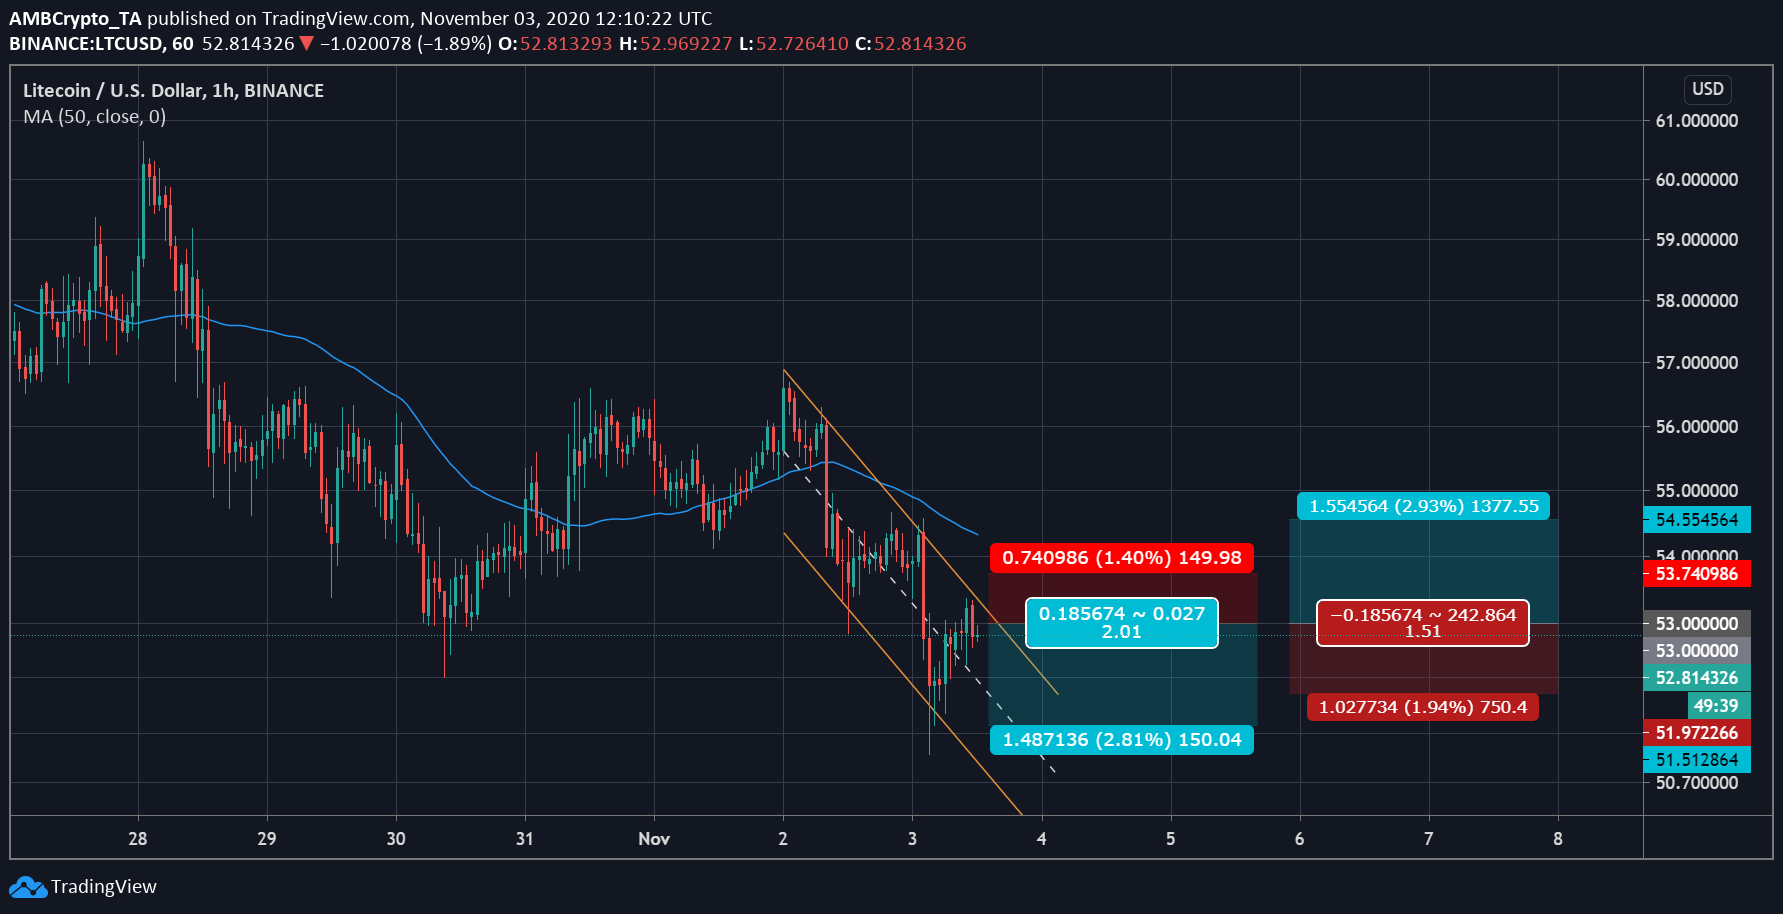
The above one-hour chart suggested that the price of Litecoin has been on a downtrend since the beginning of November, and has been bouncing within a descending channel. The 50 moving average has taken a position way above the price bars which indicated bearishness in the market.
However, Bitcoin has been noting a positive momentum making it prime for a positive breakout, which could also impact the LTC market.
Positions:
Short
Stop-loss: $53.74
Take-profit: $51.51
Stop-loss: $51.97
Take-profit: $54.55

Source: LTC/USD on TradingView
The price indicators have been indicating a push and pull among the traders’ in the LTC market. With Awesome Oscillator being in the negative with positive pressure from the buyers. While the Relative Strength Index has been close to the overbought zone and has not yet reached a state of equilibrium.
The Stochastic RSI has noted a crossover, which historically has pointed at a selling pressure merging in the market and taking the value of LTC down. If the trend sustained, the value of LTC may notice another hit soon.
Conclusion
Going forward, LTC has been poised for a move in either direction. Even though bearishness has an upper hand, the volatile Bitcoin market can change this bearish trend within minutes.

![Reasons why Litecoin [LTC] investors should be concerned](https://engamb.b-cdn.net/wp-content/uploads/2023/12/ambcrypto_A_Litecoin-themed_scen-400x240.png.webp)


