Cardano, Monero, Zcash Price Analysis: 27 October

A spike in selling pressure followed by a sudden price recovery was witnessed in the Cardano market, as volatility levels remained quite high.
Monero was seen rising on its trading charts with the digital asset maintaining a bullish stance for the short-term period.
Zcash dropping back to its support level, at press time continued to record losses, while also signaling the possibility of a price recovery over the next few trading sessions
Cardano [ADA]

Source: ADA/USD on TradingView
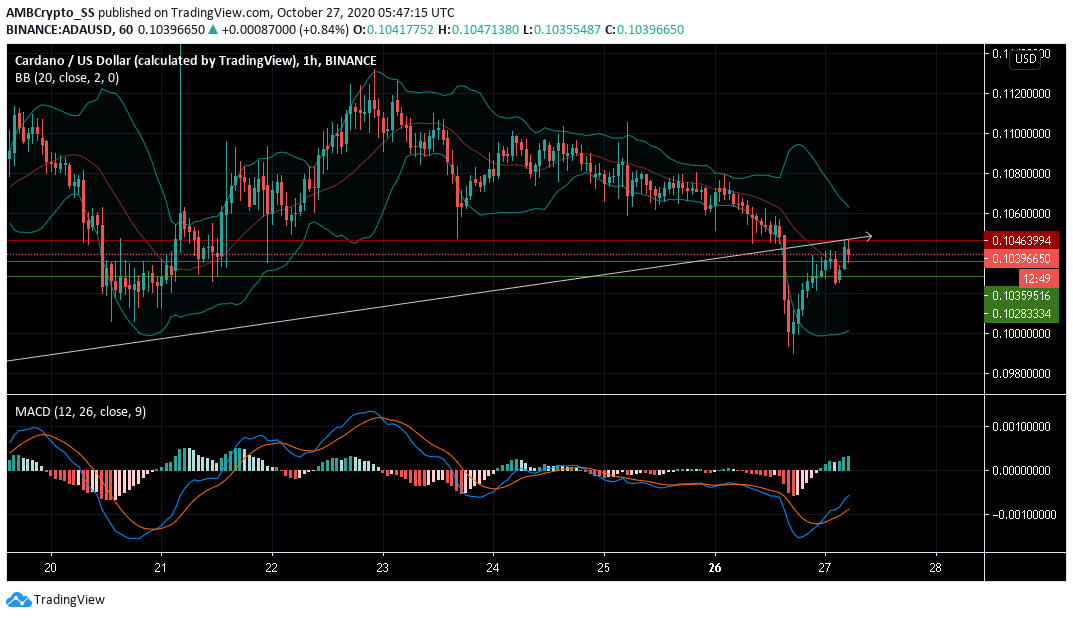
Falling short of the first major resistance level at $0.104, Cardano, at press time, slid to an early morning intra-day loss of almost 2.5% since yesterday.
Widening Bollinger bands were also indicating high levels of volatility since the start of the trading session. The wide price swings were clearly visible, as the digital asset rose towards the median band after plunging below its second support at $0.102
The immediate price rise after this sharp dip coincided with the MACD also displaying a bullish scenario. While a price recovery seems to be on the way, for the underlying asset, an opposite trend reversal may also take place given the high levels of volatility.
Monero [XMR]

Source: XMR/USD on TradingView
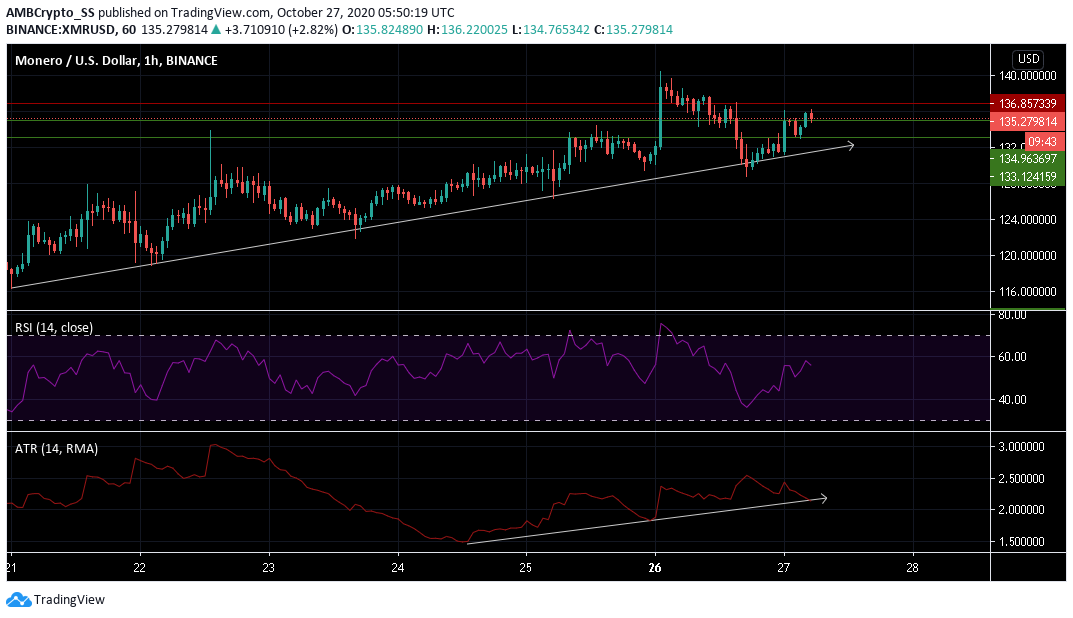
Successfully pushing above two of its key support levels, Monero’s price movement signaled a positive uptrend, with the digital asset gaining 5% over the last few days. The last traded price at the time of writing for Monero was $135.37
The Average True Range (ATR) a technical indicator measuring market volatility, also showed a considerable spike, with signs of continuously rising levels in volatility since its previous fall on 24 October.
Relative Strength Index (RSI) too was marked by a rise in buying pressures and was at the time of writing inching towards the 60 level.
Over the upcoming trading sessions, XMR bulls might try to gather control at the immediate resistance level at $136,85.
Zcash [ZEC]

Source: ZEC/USD on TradingView
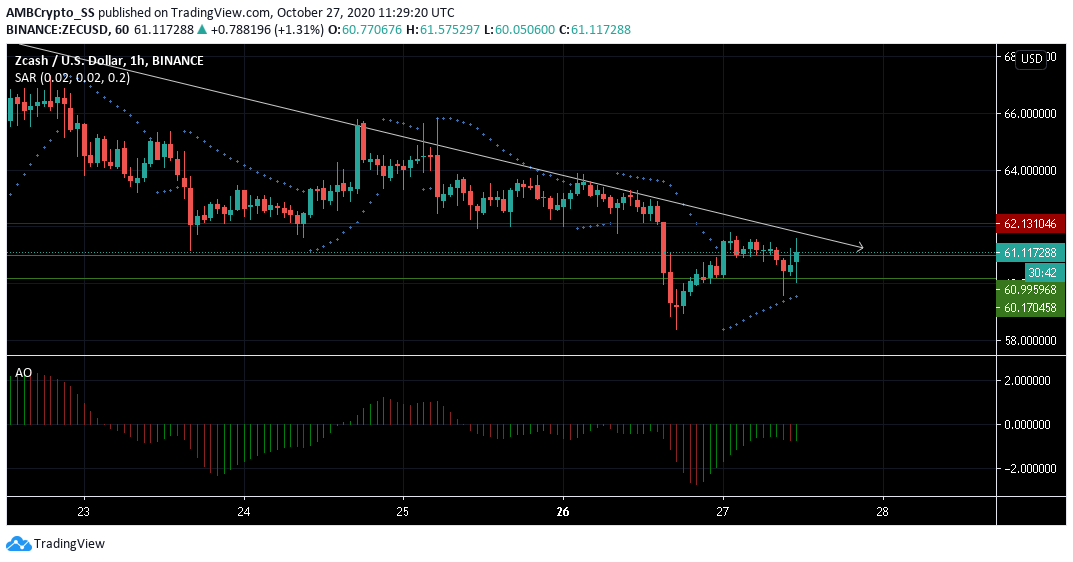
Zcash was trading at a price of $61.11, at press time. After a fall of nearly 10% from the $0.66 level over the last 48 hours, ZEC bears tried to maintain a downward pressure, pushing the prices towards the immediate support level at $60.99.
Looking at some of the technical indicators, the Awesome oscillator readings after displaying a bearish market momentum hinted towards a price correction with green closing bars below the zero line.
Despite this, the shorter-term period continued to trend lower than the long term. The dotted lines of Parabolic SAR below the candles were also signaling an upward price trend.
While the bulls failed to dominate the ZEC market, they could soon improve their position in the upcoming trading sessions. A pullback above the immediate support level could confirm the prospects of a rise in future buying pressures.


