Cardano, Zcash, DigiByte Price Analysis: 20 October

Bitcoin surged to touch $11,800 and Crypto Fear and Greed Index stood at 56. A positive correlation with gold and S&P500 could drag Bitcoin down in the coming weeks, due to uncertainty in the economy and the upcoming US elections. Cardano hinted it was in a period of low volatility while Zcash and DigiByte have seen losses in recent days and could see more in the coming days.
Cardano [ADA]

Source: ADA/USD on TradingView
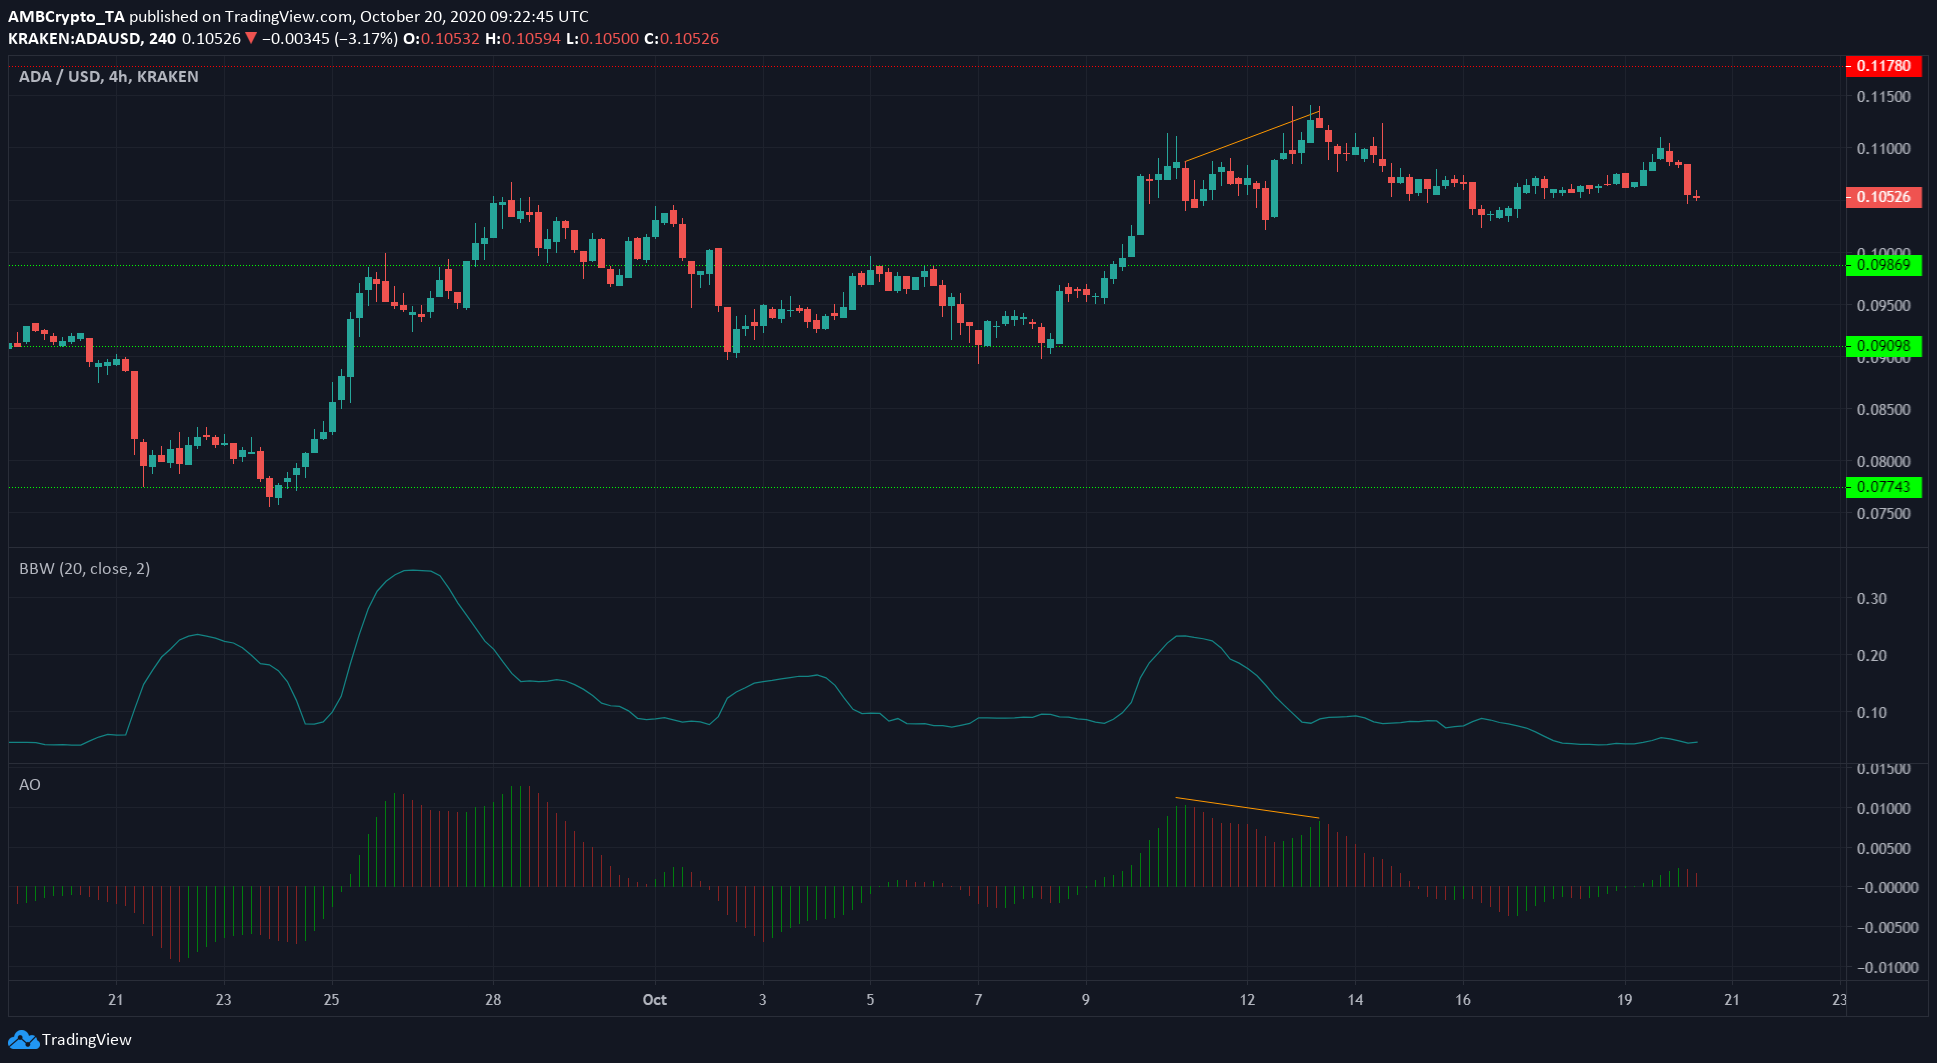
ADA showed twin bearish peaks set up a few days ago as it registered higher highs despite waning bullish momentum. The price corrected to $0.1035 and was trading at $0.105 at press time.
The Bollinger Band Width was at a low it had not reached for nearly a month. The last time the width was so tight, ADA broke out to the downside and lost $0.09 support in a move that tested $0.077 as support.
This time, a break need not necessarily be to the downside, however, a breakout can replicate a similar-sized move.
Cardano was in the news recently when it was reported that Cardano and Litecoin were exploring a “Velvet Fork” Partnership.
Zcash [ZEC]

Source: ZEC/USDT on TradingView
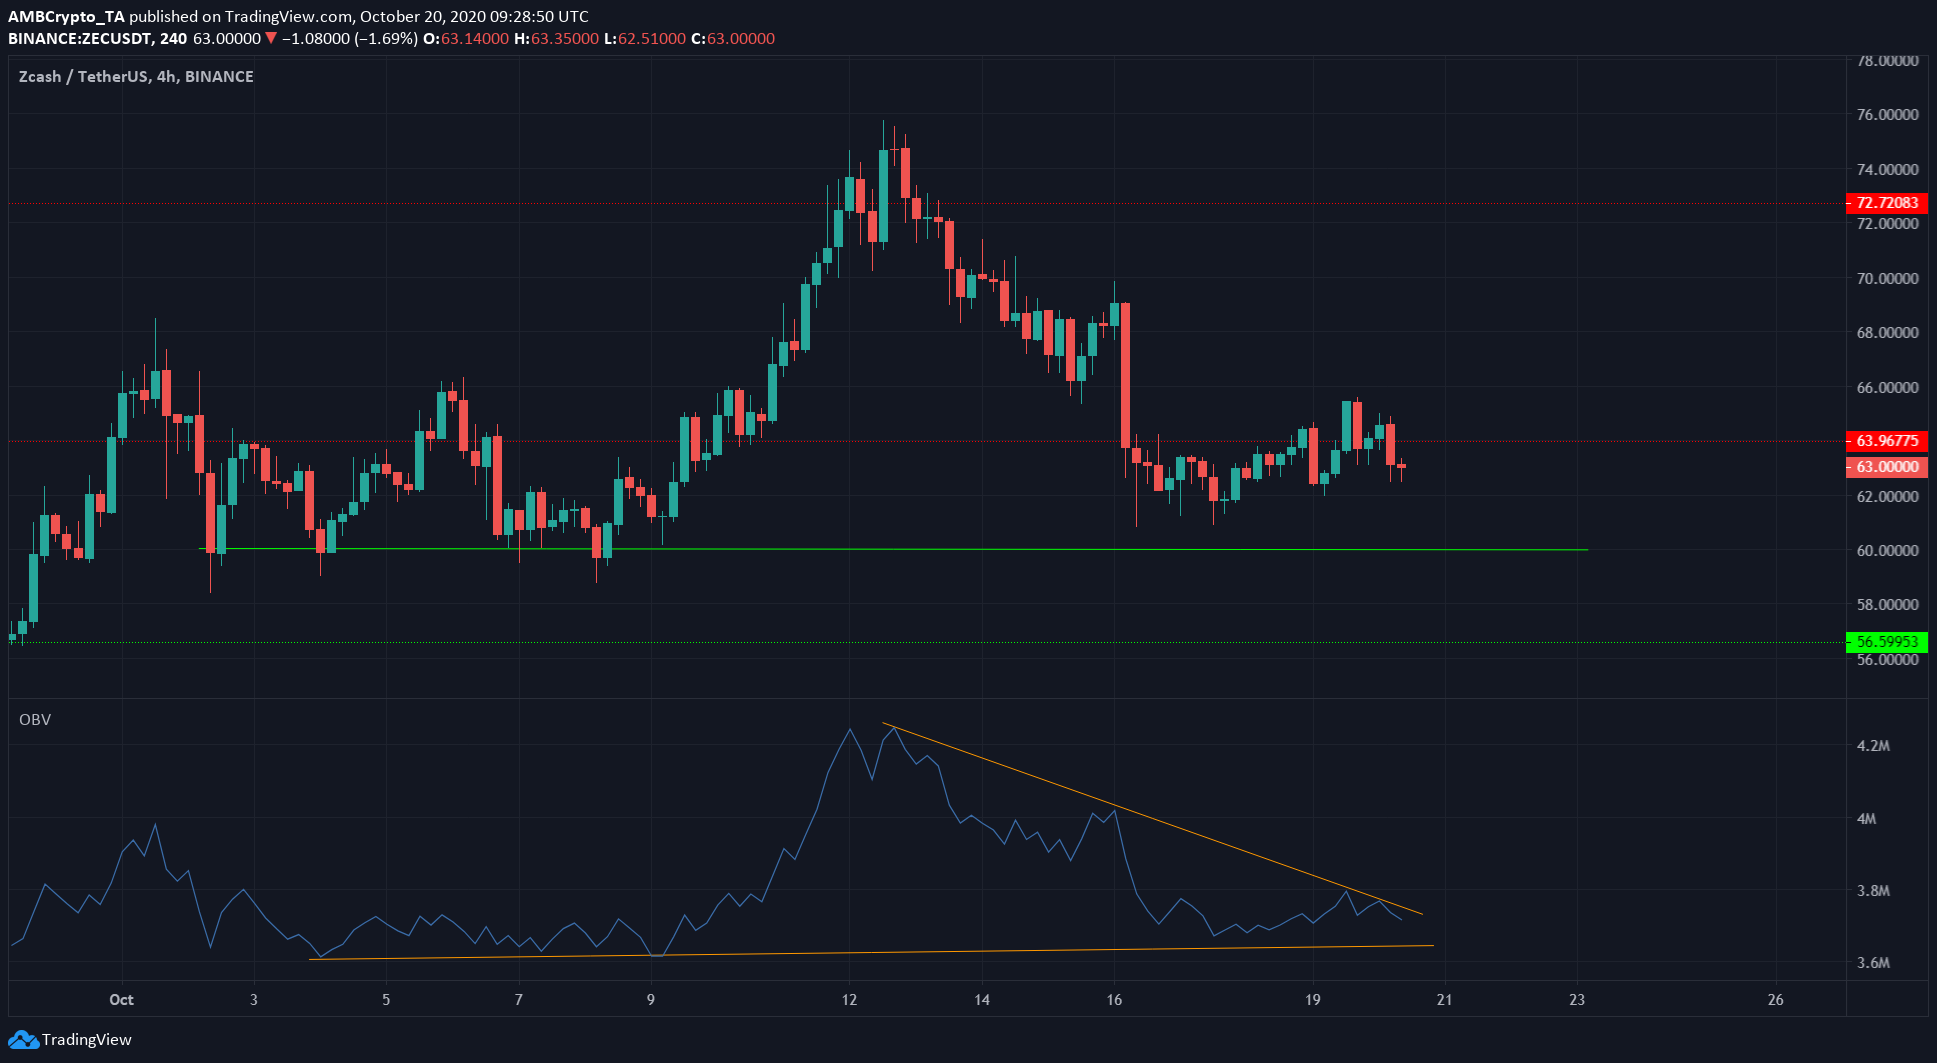
ZEC had a level of resistance at $64, which it attempted to surmount but failed to in the past few trading sessions. It also had a strong level of support at $56.6.
In green is highlighted a critical level of $60 for ZEC bulls to hold. The price has been trending downward in recent days, but according to the OBV, $60 could be the floor for the asset in October as it has seen buyers step in when the price retreated to $60.
A drop beneath $60, followed by a lack of buying volume on the OBV (a break beneath the flat orange trendline) would see ZEC post further losses.
DigiByte [DGB]

Source: DGB/USD on TradingView
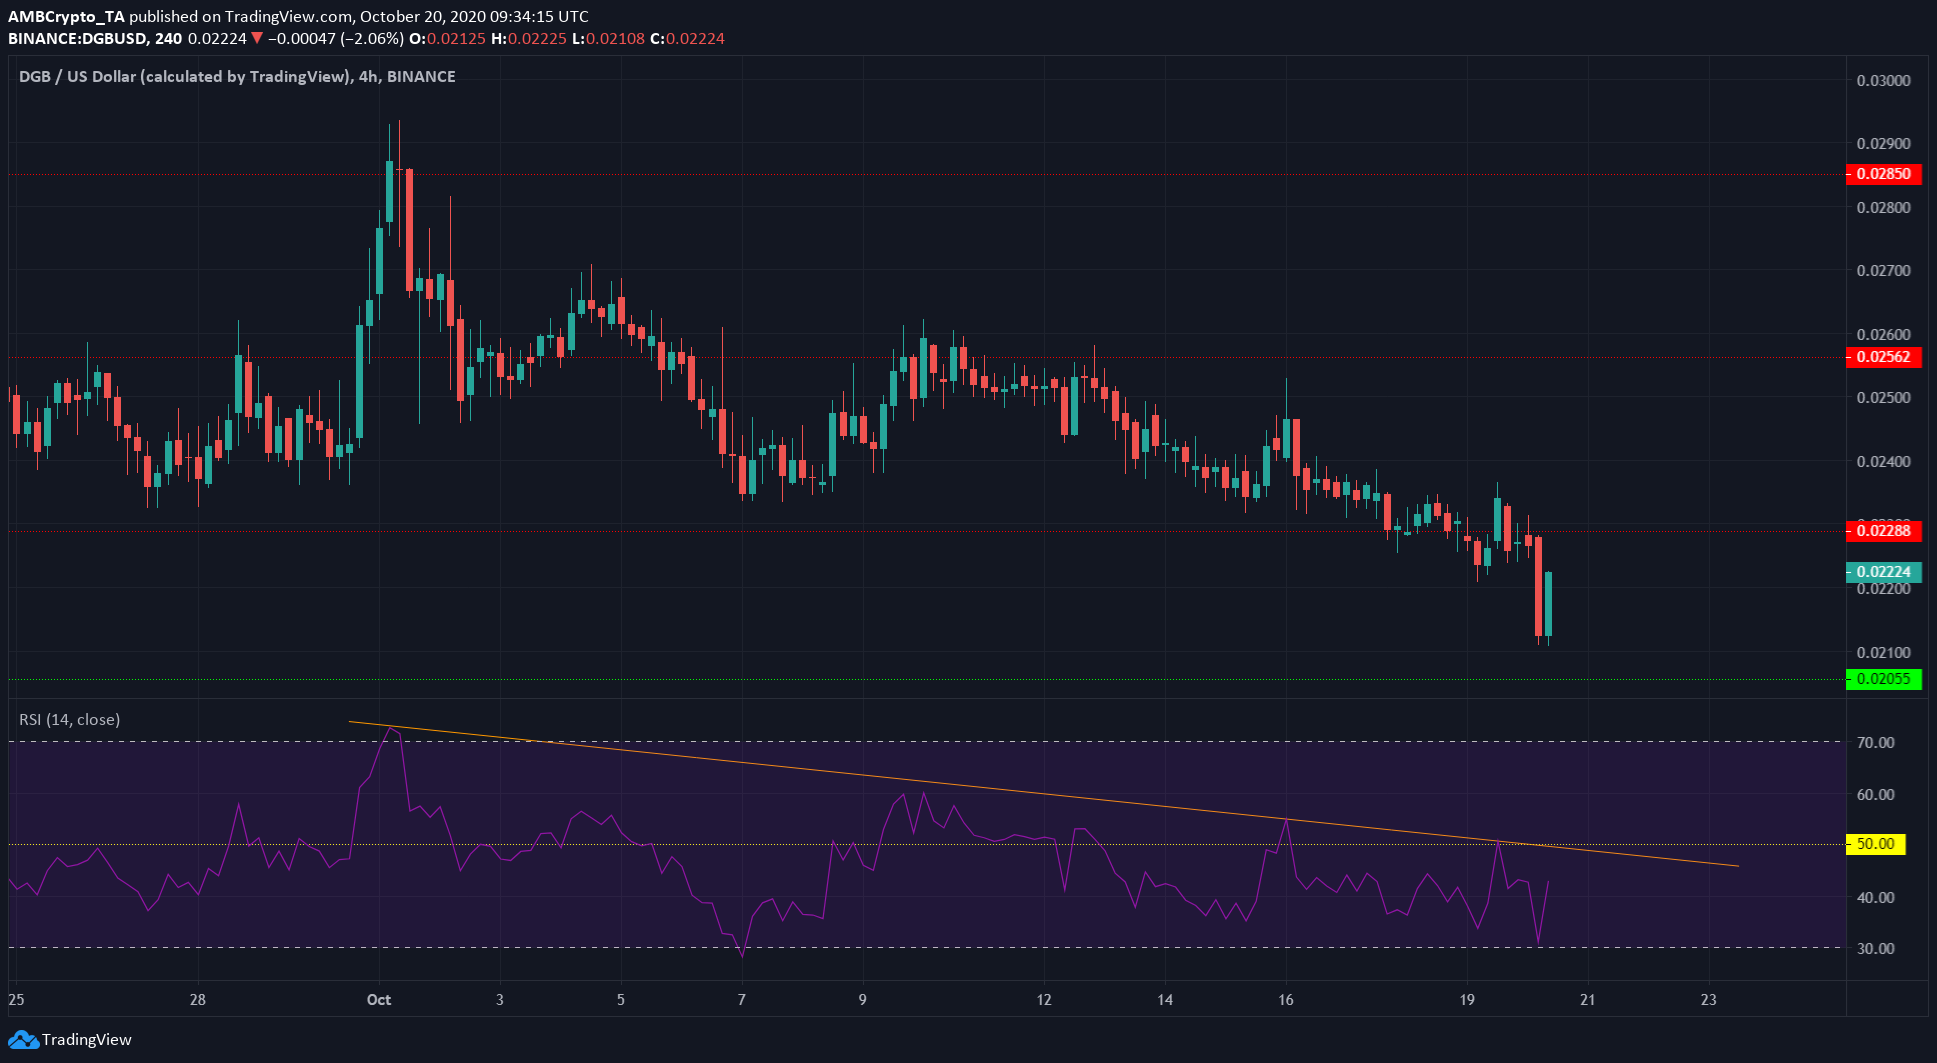
The price has been forming lower highs in a downtrend that is captured by the orange trendline on the RSI. Attempts at recovery have been nothing more than bounces in the asset price from near oversold levels.
The trend was set to continue so long as the RSI stayed beneath the descending trendline. A break past it, along with a rise beyond 50, could confirm some positive momentum for the asset.
It would not signal a trend reversal, however, but would provide a good short-term trade opportunity.


