Bitcoin SV, Cosmos, Ethereum Classic Price Analysis: 08 September

Bitcoin SV has been in an uptrend in the past couple of days. It remains to be seen if it has the strength to reclaim important moving averages. The uptrend might be part of a bearish reversal pattern and could cause a drop in the coming sessions if it played out. Cosmos and Ethereum Classic appeared to have many traders and investors sitting on the sidelines, waiting for the market to decide its next direction while it consolidated above a retracement level.
Bitcoin SV [BSV]

Source: BSV/USD on TradingView
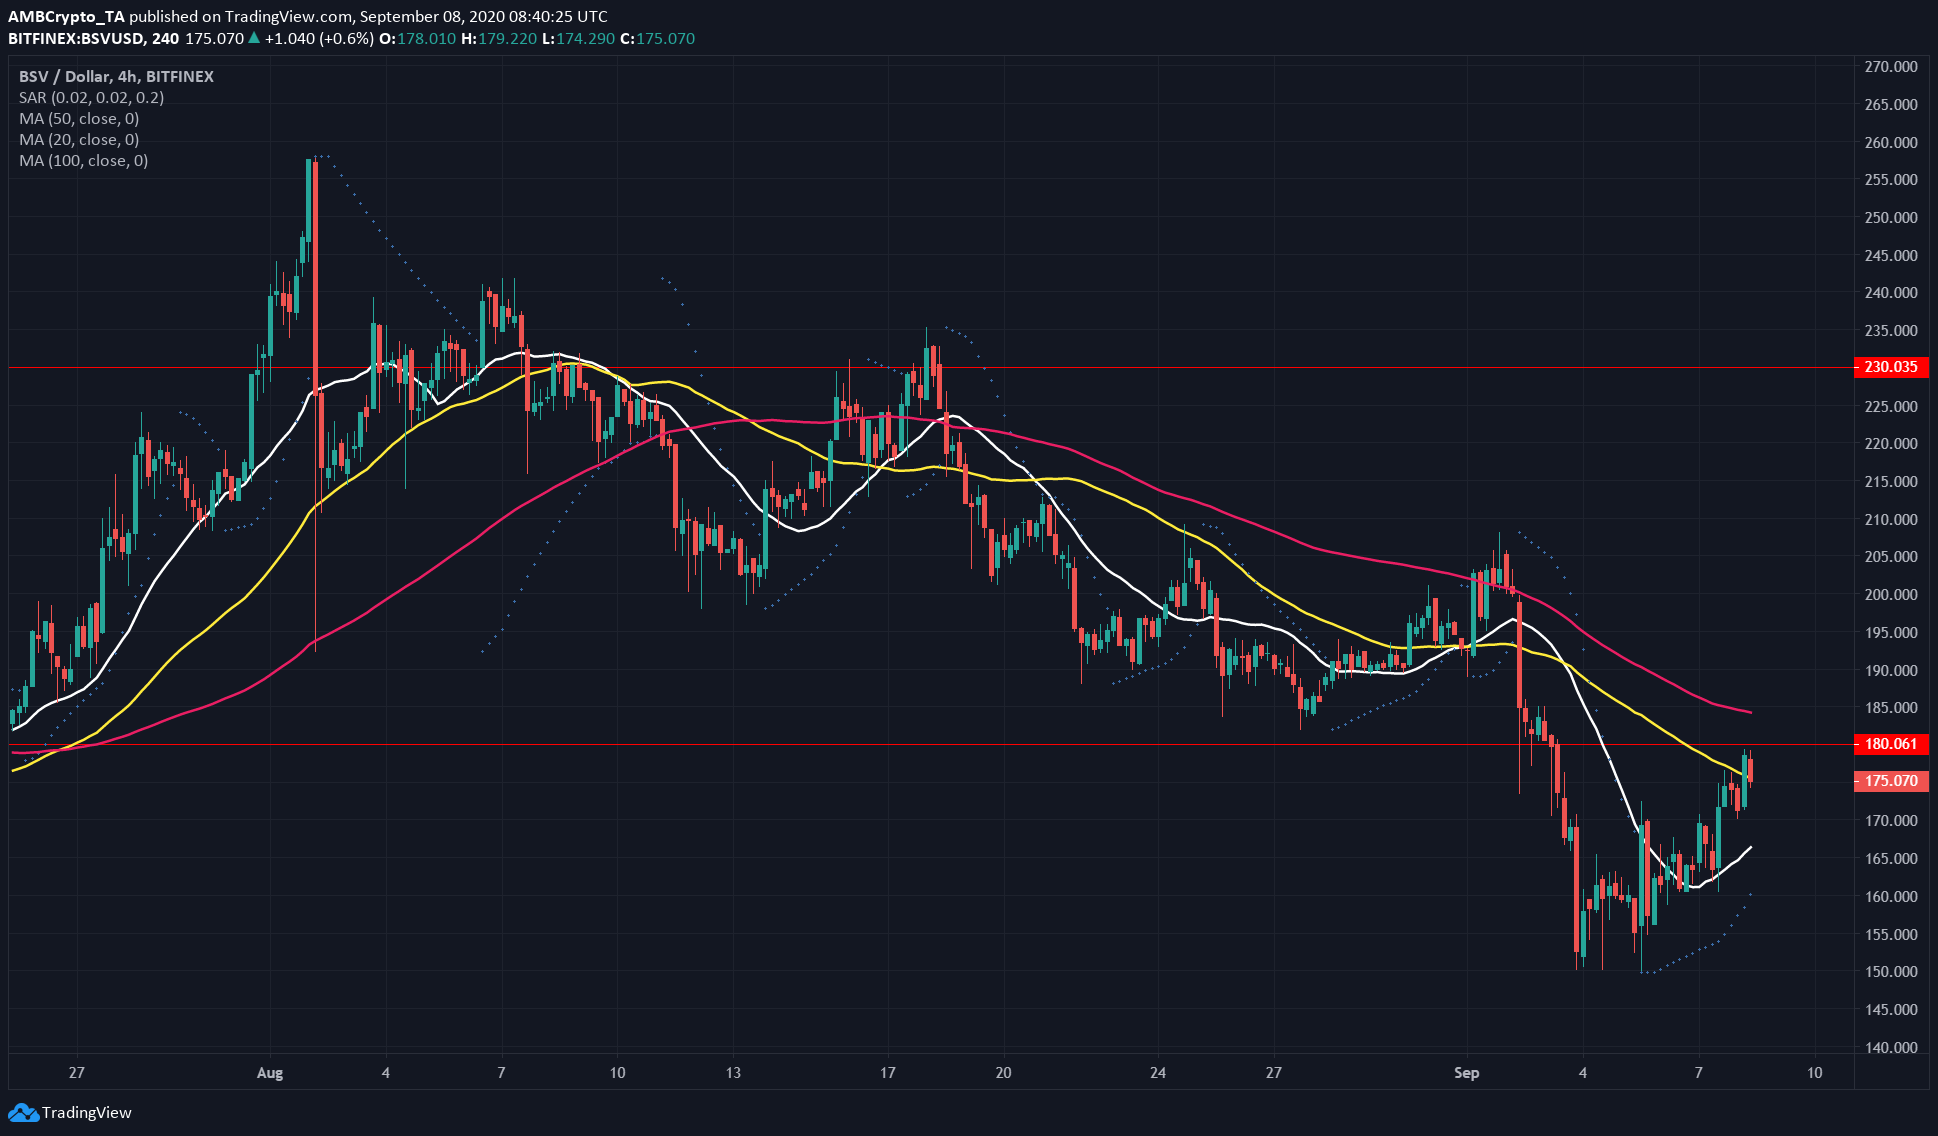
Bitcoin SV was on a short term uptrend and was trading just underneath resistance level at $180. The asset was valued at $175 at press time.
20 SMA (white), 50 SMA (yellow) and 100 SMA (purple) indicated that BSV might have begun recovery. Price was above 20 SMA, had broken past 50 SMA and appeared to be retesting it at the time of writing. 100 SMA, which can be expected to act as resistance to price as well, was above nearest resistance level.
Parabolic SAR showed a buy signal. BSV could add strength to its recovery if it reclaimed resistance and traded above 100 SMA.
If BSV failed to move past resistance with force, it could be forced down as a rising wedge was being formed. Price could drop to $150 if the pattern is validated.
BSV was recently listed on the Korean exchange Hotbit.
Cosmos [ATOM]

Source: ATOM/USDT on TradingView
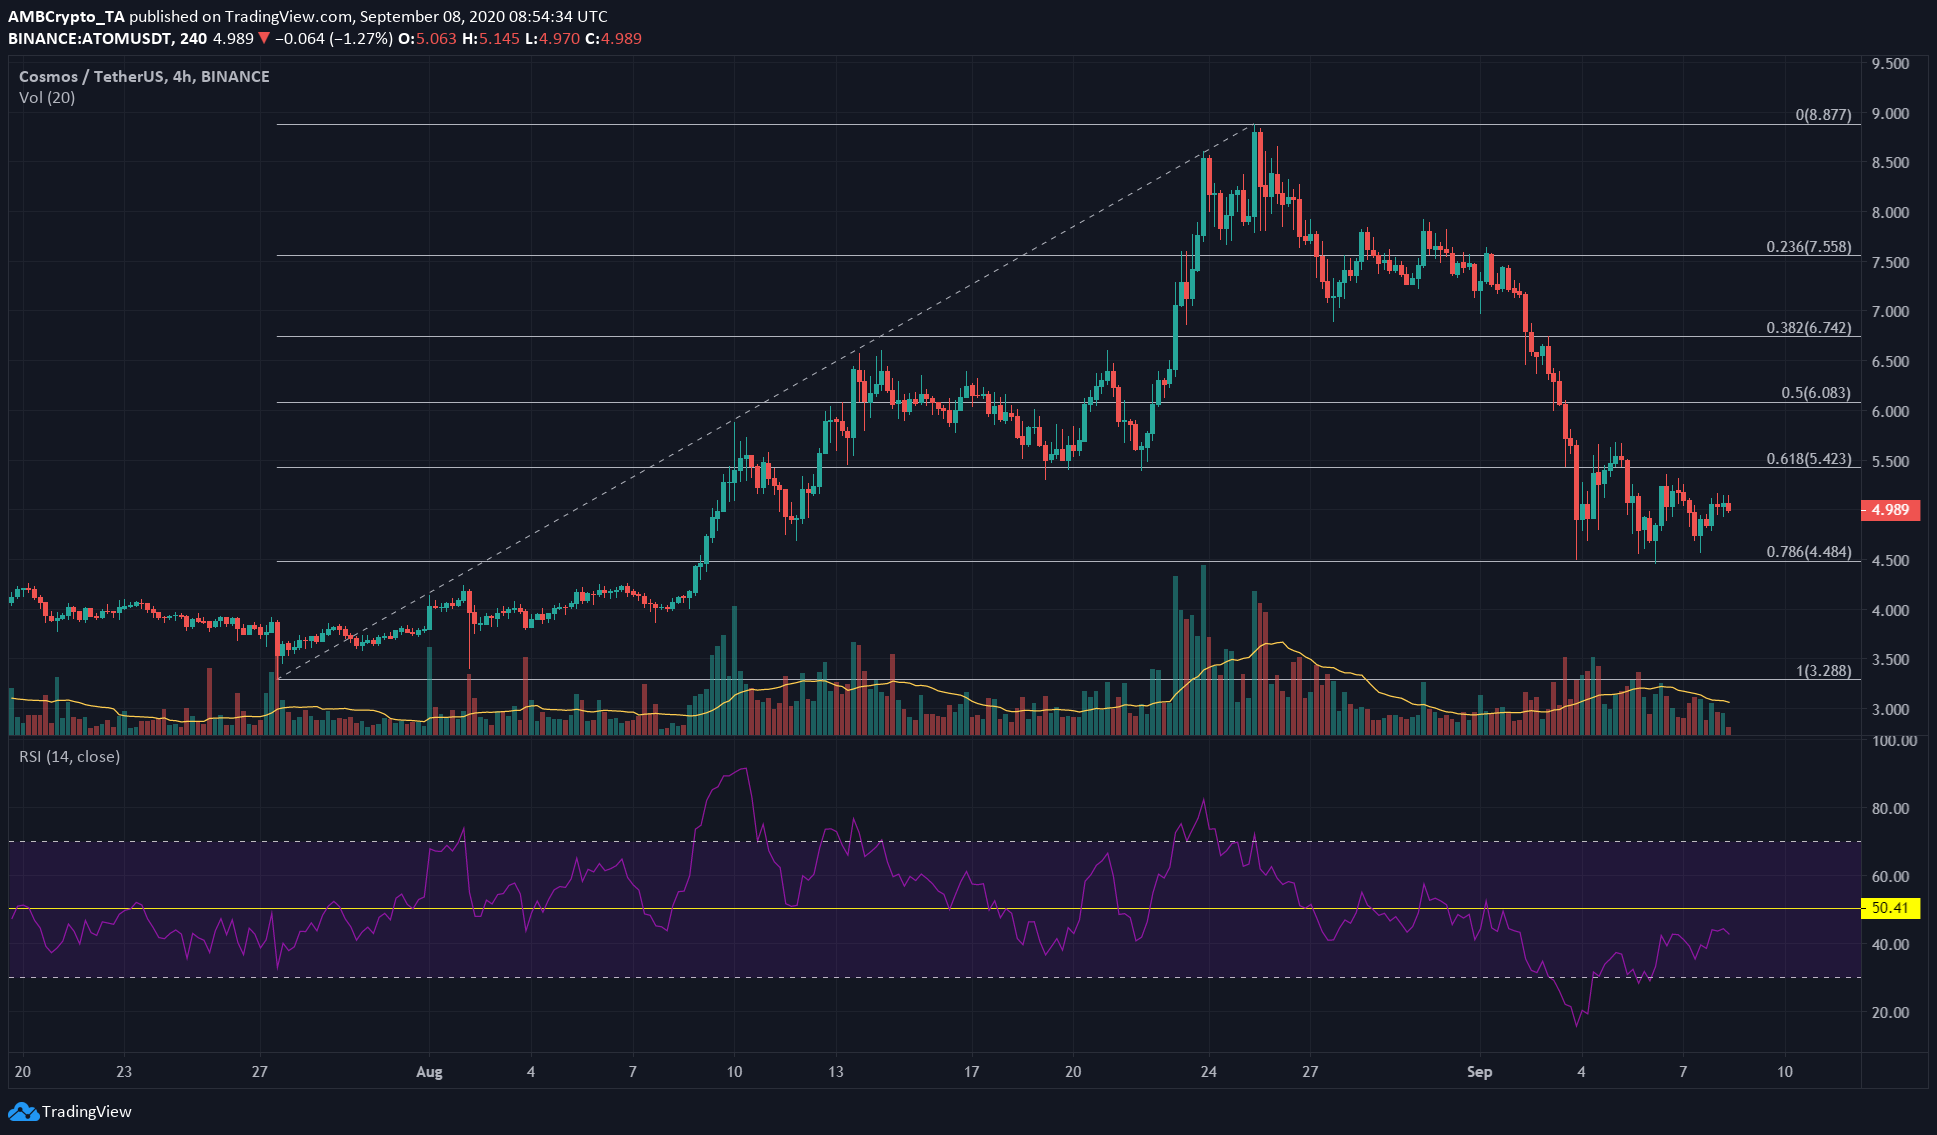
ATOM was bouncing off the 78.6% retracement level, highlighted by Fibonacci Retracement tool. Each bounce formed a lower high, which did not bode well for the asset and pointed to a further slide for ATOM.
Each bounce had decreasing trading volume as well. The next move that ATOM makes with a good volume is likely the direction ATOM will be headed in.
RSI remained in bearish territory, with a value of 44, and was unable to rise above neutral 50 in the past week.
The retracement levels to the upside could act as resistance. ATOM has levels of support at $3.75 and $3.16 region to the downside.
Ethereum Classic [ETC]

Source: ETC/USDT on TradingView
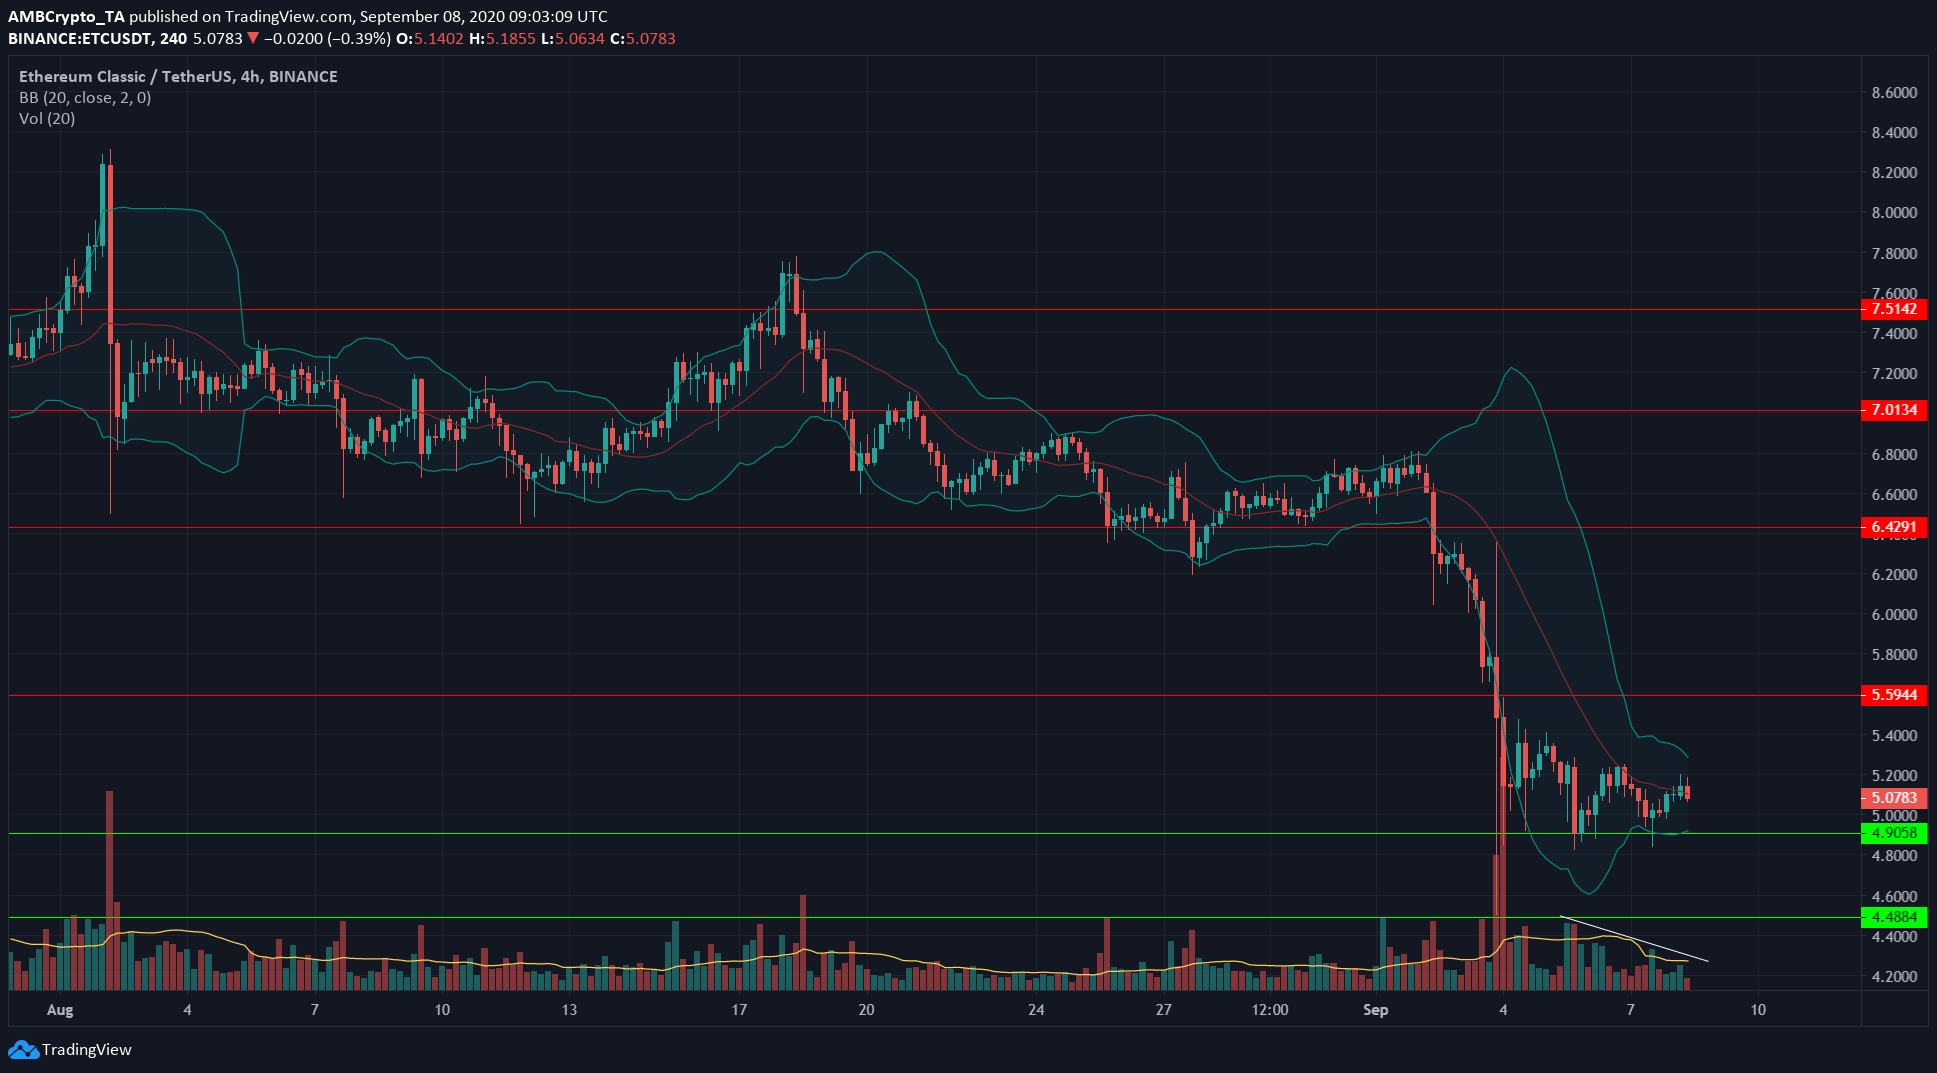
Ethereum Classic was another asset that showed decreasing trading volume in the past few sessions, highlighted by the white trendline.
Bollinger bands were also contracting around the price. This indicated a decrease in volatility. It also signals that, whichever side price breaks toward, can have good momentum.
In conclusion, a break by ETC toward either side of the 20 moving average shown in Bollinger bands, will signal the direction of ETC’s next strong move.


