Bitcoin’s fractal suggests a probable dump in the next few weeks

Fractals aren’t new phenomena; they’ve existed in nature and are thought to be as old as the Earth itself, probably even older. Greeks knew about this phenomenon and termed it the ‘Golden Ratio,’ using it in their construction and considering it profound. So profound that they believed that it was passed down by the Gods themselves.
Golden Ratio aka 1.618 is found in plants and various creatures, even in humans. Similarly, fractals repeat, but on different time frames and even scales. Identification of this pattern, irrespective of the time frames or scales, gives an idea about how history could repeat itself. Hence, Mark Twain’s quote,
“History doesn’t repeat itself but it often rhymes.”
FRACTALS
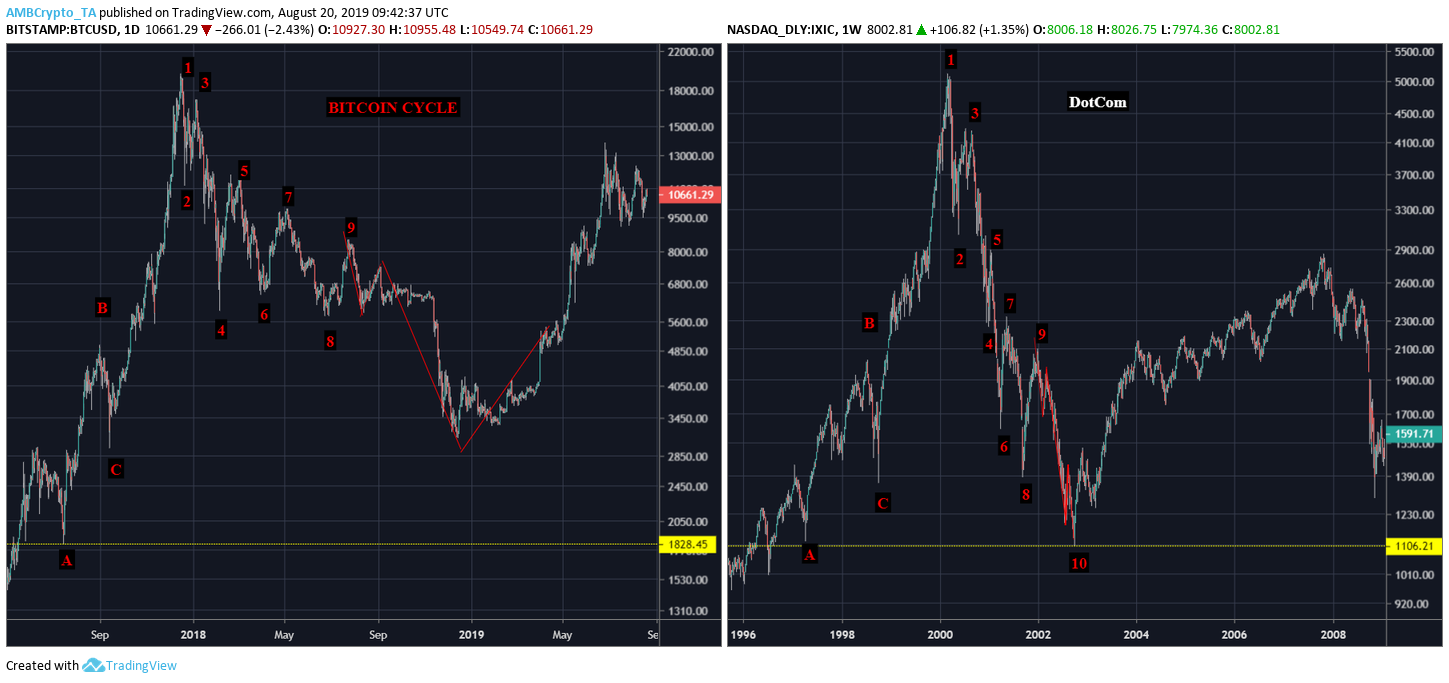
Humans are creatures of habit and ergo, any asset traded has the history of collective emotions of these humans reflected in the price trend. Hence, knowingly or unknowingly, we see the formation of fractals. As an introduction, below are illustrations of similar fractals formed over different time frames and in completely unrelated assets.
Bitcoin v. Gold

Source: TradingView
Bitcoin v. DotCom

Source: TradingView
Sometimes, these fractals can be found in different cycles of the same asset. The case of Bitcoin 2013-2015 v. Bitcoin 2017-2019 is a prime example of the same.
PAST MEETS THE PRESENT
As of now, there is an eery similarity that might just explain how Bitcoin might break out of the pattern that has been consolidating for about 8 weeks.
2013 and 2019
Bitcoin hit a high of $1,164 in late 2013. Five months later, the price tumbled down from the then all-time high to a bottom of $339. The price surged by 100% from this point on and seemed like it would reconquer old highs. The surge faced a blockade when it was only 71% away from the recent ATH. Following the same, a consolidation pattern, much similar to the one that is being seen right now was formed.
The pattern that looked like a bullish pennant, with an obvious bullish breakout, did exactly the opposite. There might have been different factors that may have made this happen, but what’s important is that the price broke out to the bottom, even when the pattern indicated a bullish breakout.
As of now, Bitcoin is in a similar pattern, consolidating, and the prior bullish trend indicates a bullish breakout. If the breakout is in any way similar to the one explained above, it will breakout to the bottom.

Source: TradingView
From the above chart, it is clear that the current scenario is but a repetition of the 2013-scenario, but on a different scale. The similarities observed among the two include,
- Prior Trend
- Sudden collapse leading to a bottom [although a temporal bottom]
- Sudden surge giving rise to diminishing twin peaks
- Consolidation
Bitcoin recent suffered a massive dip down to the $9,400 levels, following which, the price pumped above $10,000 and has been hovering around the $10,700 region for a while. The price is awaiting a breakout from the consolidation pattern, something which would further reintroduce volatility to the Bitcoin market. What most hodlers/traders are wondering is the direction of the breakout from this pattern. If the 2013 fractal plays out, it is more than apparent that the breakout will be to the downside.
Supporting Evidence for Bearish Breakout

Source: TradingView
The RSI indicator shows yet another similarity between 2013 and 2019, i.e. the peak RSI at the formation of intermediate price peak, the collapse of RSI, the parallel rise in RSI and finally, the diminishing triple peak. All of these can be in the chart attached above. Another uncanny similarity is seen in the MACD indicator. The MACD peaked towards the price peak, and was followed by a dip below the zero-line, two bottoming peaks.
PROBABLE OUTCOME
Bitcoin breaking the consolidation pattern to dip to the bottom is something that can be confirmed from the fractal of 2013-2014-2015. A breakout to the top seems less than likely, but there is still a possibility of that happening.
Expect a breakout of the pattern by the end of August or by early to mid-September, most likely to the bottom and in the price range of $10,000 to $8,000, with the worst-case scenario being as low as $5,800.


