Analysis

Bitcoin’s grim future indicates a retest of $6,515 and perhaps lower
Posted:
| Last updated: February 14th, 2024

Key Takeaways
- Multiple outcomes indicate a converging bearish case for Bitcoin in the coming week.
- The 4-hour chart shows a dip below the $7,000 region and a retest of November 25 low, $6,515.
- Further bearish momentum could slide Bitcoin to $6,200, and possibly to $5,920.
As Bitcoin’s price lugs in the $7,000 region for the 3rd week in a row, the U.S. and other European miners are taking hits due to mining unprofitability. A few days before Bitcoin collapsed from the $8,000 region, a total of ~$17 million BTC moved out of miners’ wallet, indicating miner capitulation. Since its drop to the $6,515 on November 25, the price has not revived completely.
At press time, BTC moved sideways priced at $7,195 with a market cap of $130 billion. The next move for Bitcoin is as predictable as a coin toss: the chances are 50-50.
Multiple Probabilistic Outcomes
The 4-hour chart showed two strong overhead resistances for Bitcoin since October 28. At present, there are multiple supports and hence variable outcomes for Bitcoin.
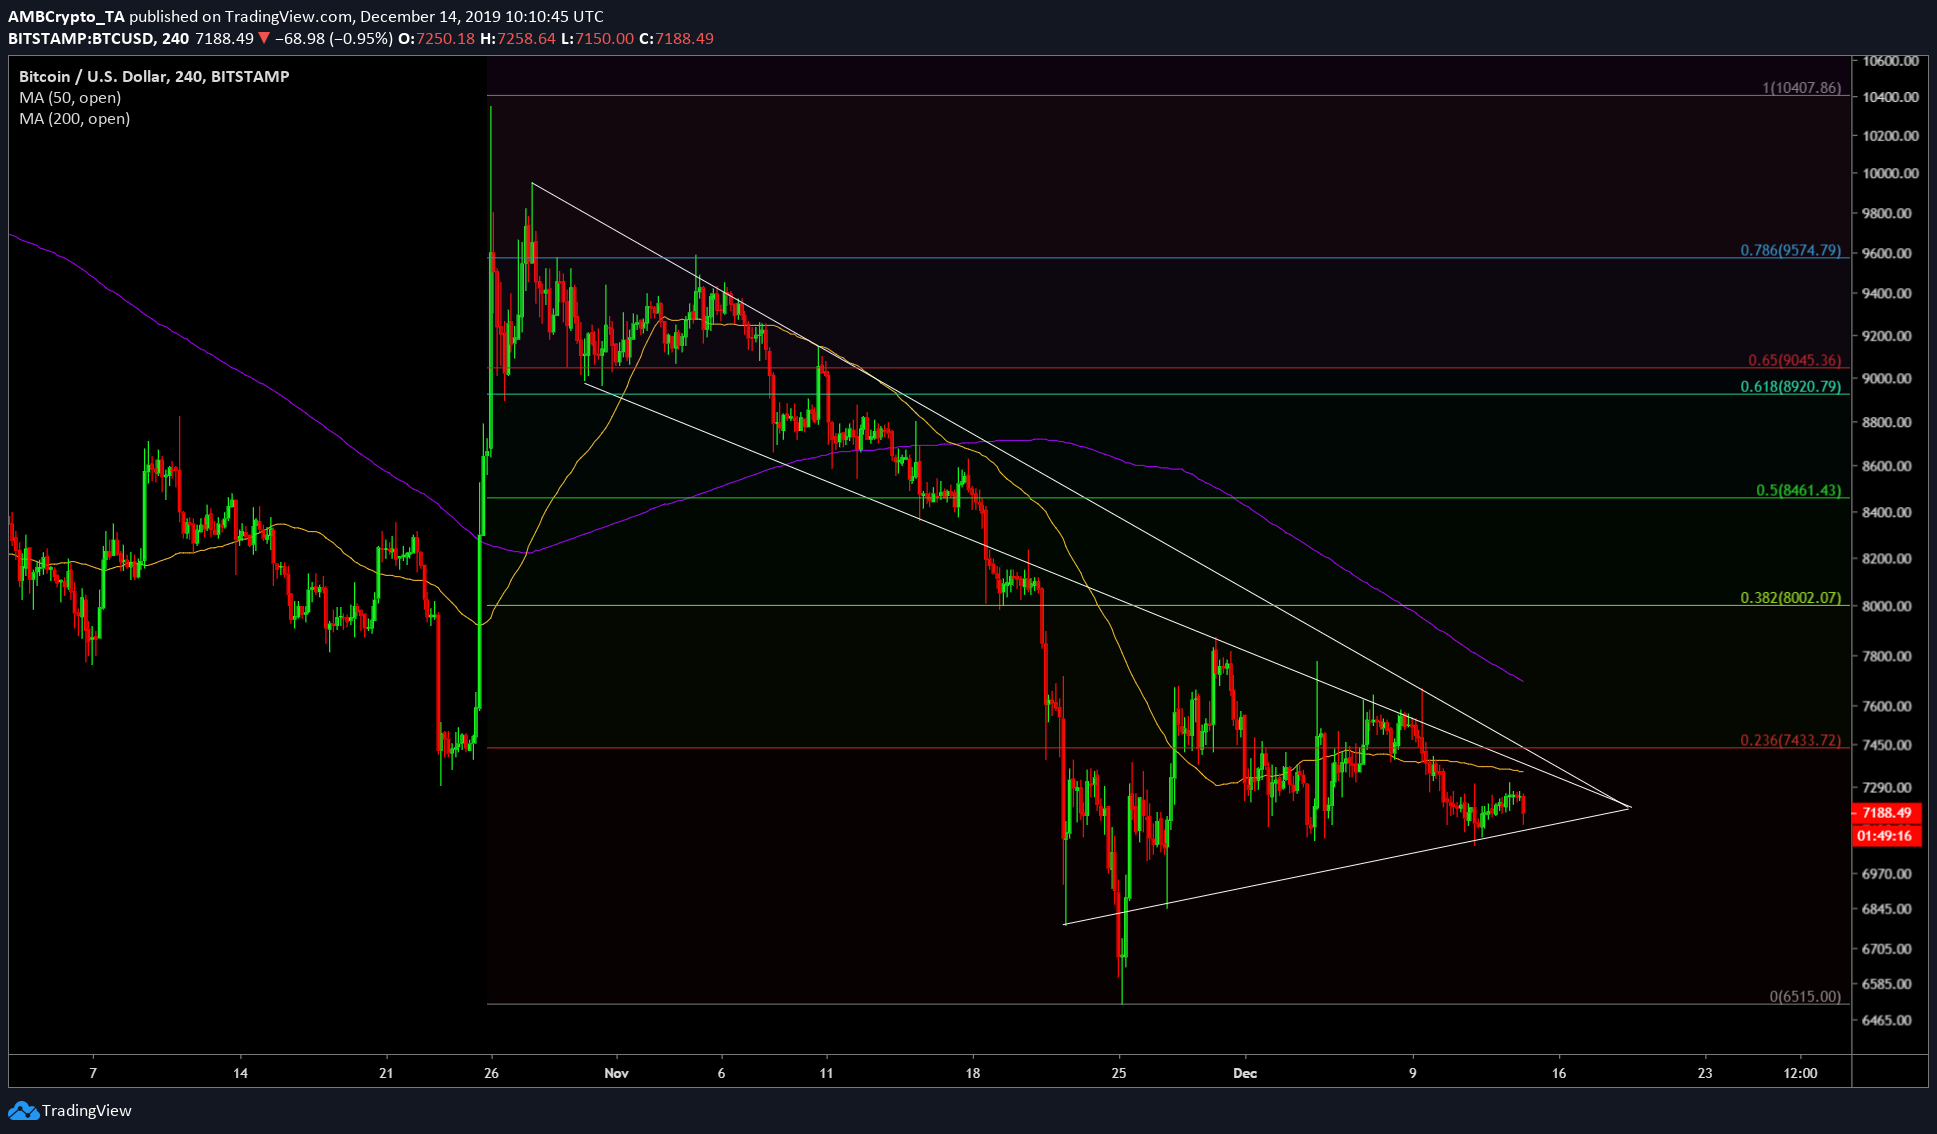
The first outcome is a Symmetrical Triangle which could push the price of Bitcoin either way.
The second outcome is a Descending Triangle which has a higher chance of pushing Bitcoin further below, perhaps, even retest $6,515.
Symmetrical Triangle
Source: BTC/USD TradingView
The price has consistently formed lower highs, which exudes bearish presence; there are, however, formations of higher lows, indicating resisting bulls. The bearish signs seen on MACD and RSI push the probability in favor of bears.
The Fibonacci Tool showed the price crawled up below the last second level, $7,433 [23.6%], indicating chances of the next drop retesting the $6,515 level.
Descending Triangle
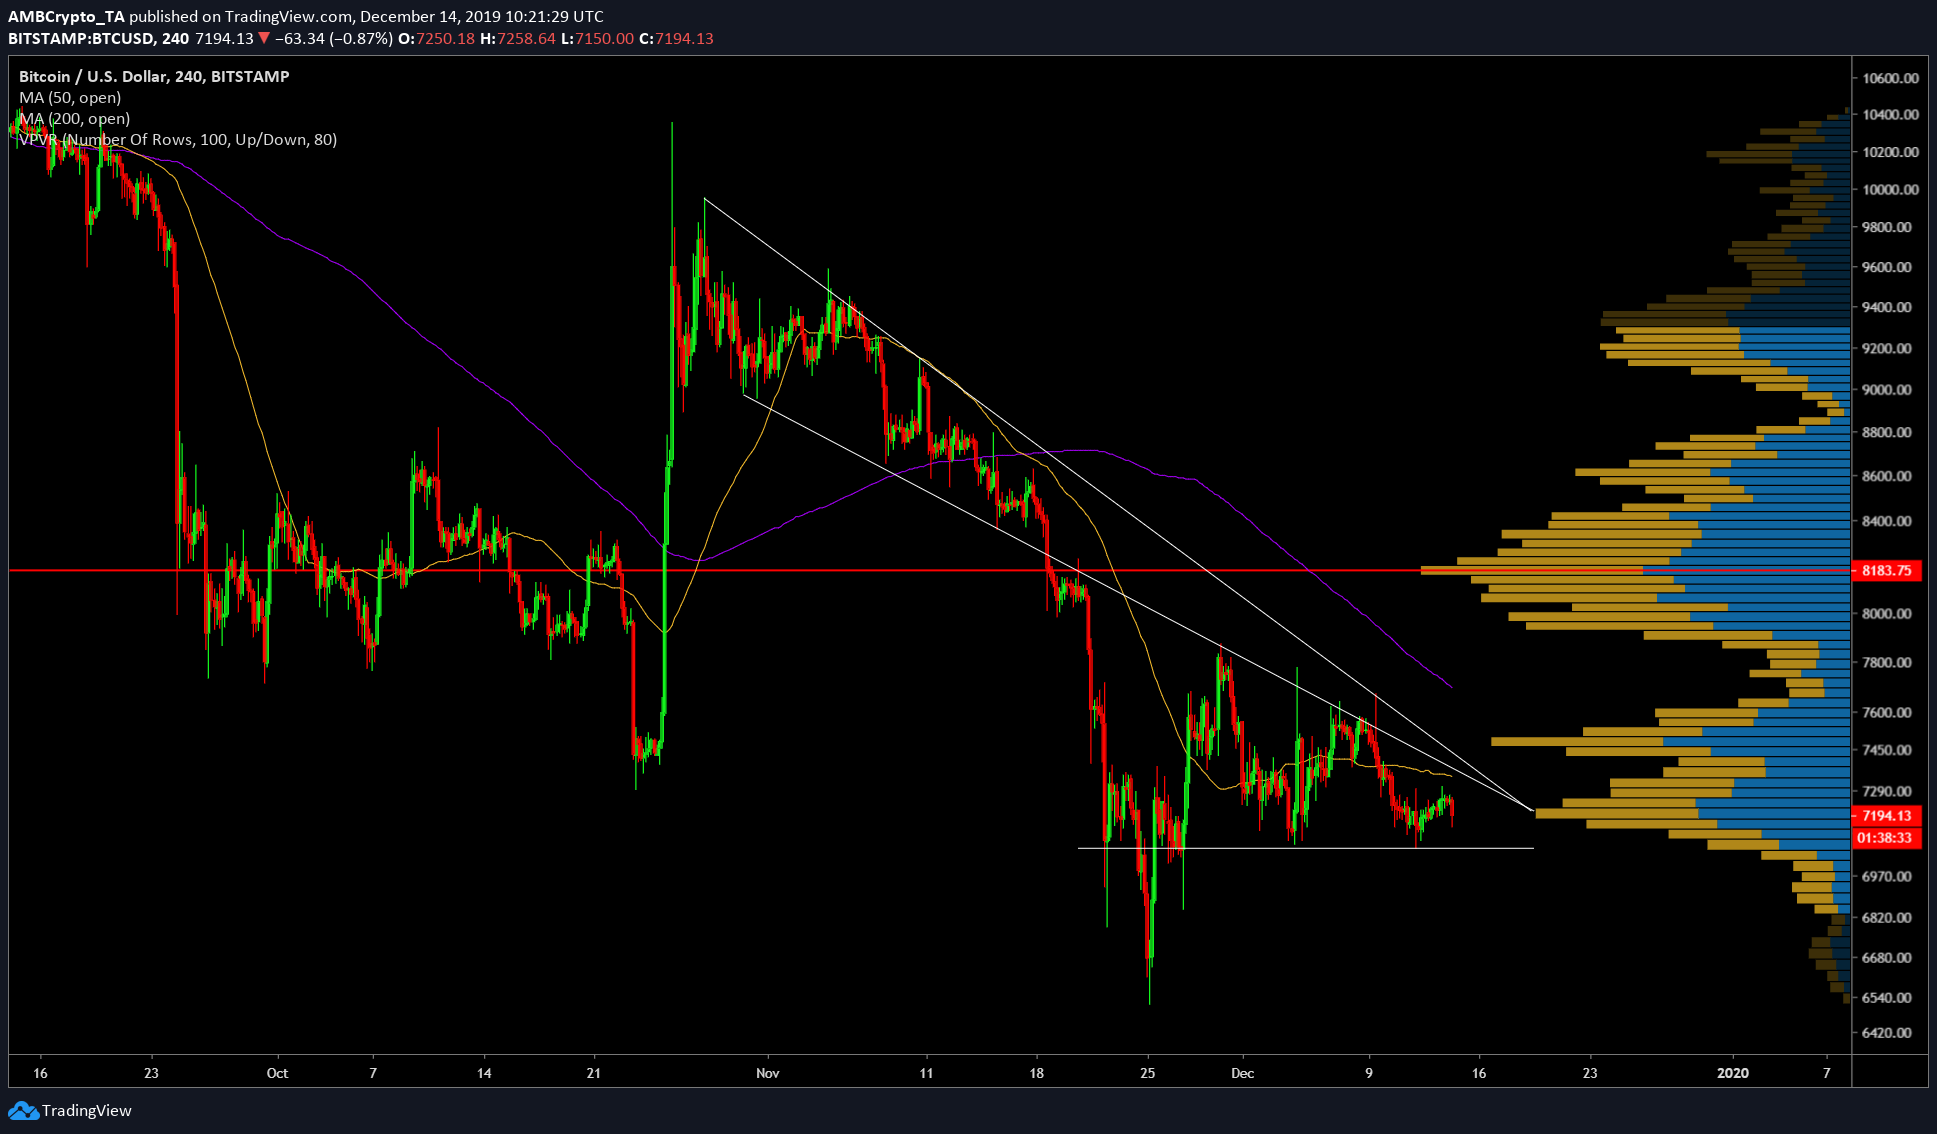
Source: BTC/USD TradingView
The overhead resistances starting from October 28, 30, are presenting a challenge for the buyers, hence the lower highs for BTC. Moreover, tweaking the horizontal support, we get a descending triangle, which inherently has a bearish bias.
Factoring other indicators like the downtrend which has loomed over Bitcoin since June 26, the bearish case gets stronger. Another reliable indicator, VPVR, indicates that BTC’s price is hanging by a thread and that further bearish pressure could cause it to slip further below.
Converging Outcomes
For both of the above formations, BTC shows a bearish bias and hence converges toward an incoming dump in the near future. Supporting this theory and hence catalyzing these outcomes is the Death Cross, which has loomed over Bitcoin since October 25. The bearish scenario would allow the price of BTC to retest the $6,515 lows. Dipping as low as $6,200 in the next week. Further bearish momentum should logically cause a steeper move to $5,920.
A Hail Mary?
Since Bitcoin’s rallies are out of the blue, there is a rather slim chance that could defy all the technical indications and could take BTC higher. Although unlikely, if it does occur, the price would be immediately stopped at $8,000.


![Real-world assets [RWA]: How to invest in Gold & Real Estate on-chain](https://engamb.b-cdn.net/wp-content/uploads/2026/02/Samyukhtha-5-400x240.webp)
