
Chainlink appeared to be in a phase of consolidation, although the price could also suffer a minor drop. Cosmos was perched on a level of support, and can be expected to rise higher after breaking out of a bullish reversal pattern. Dogecoin continued to trend lower, as it has done since its huge pump in July.
Chainlink [LINK]
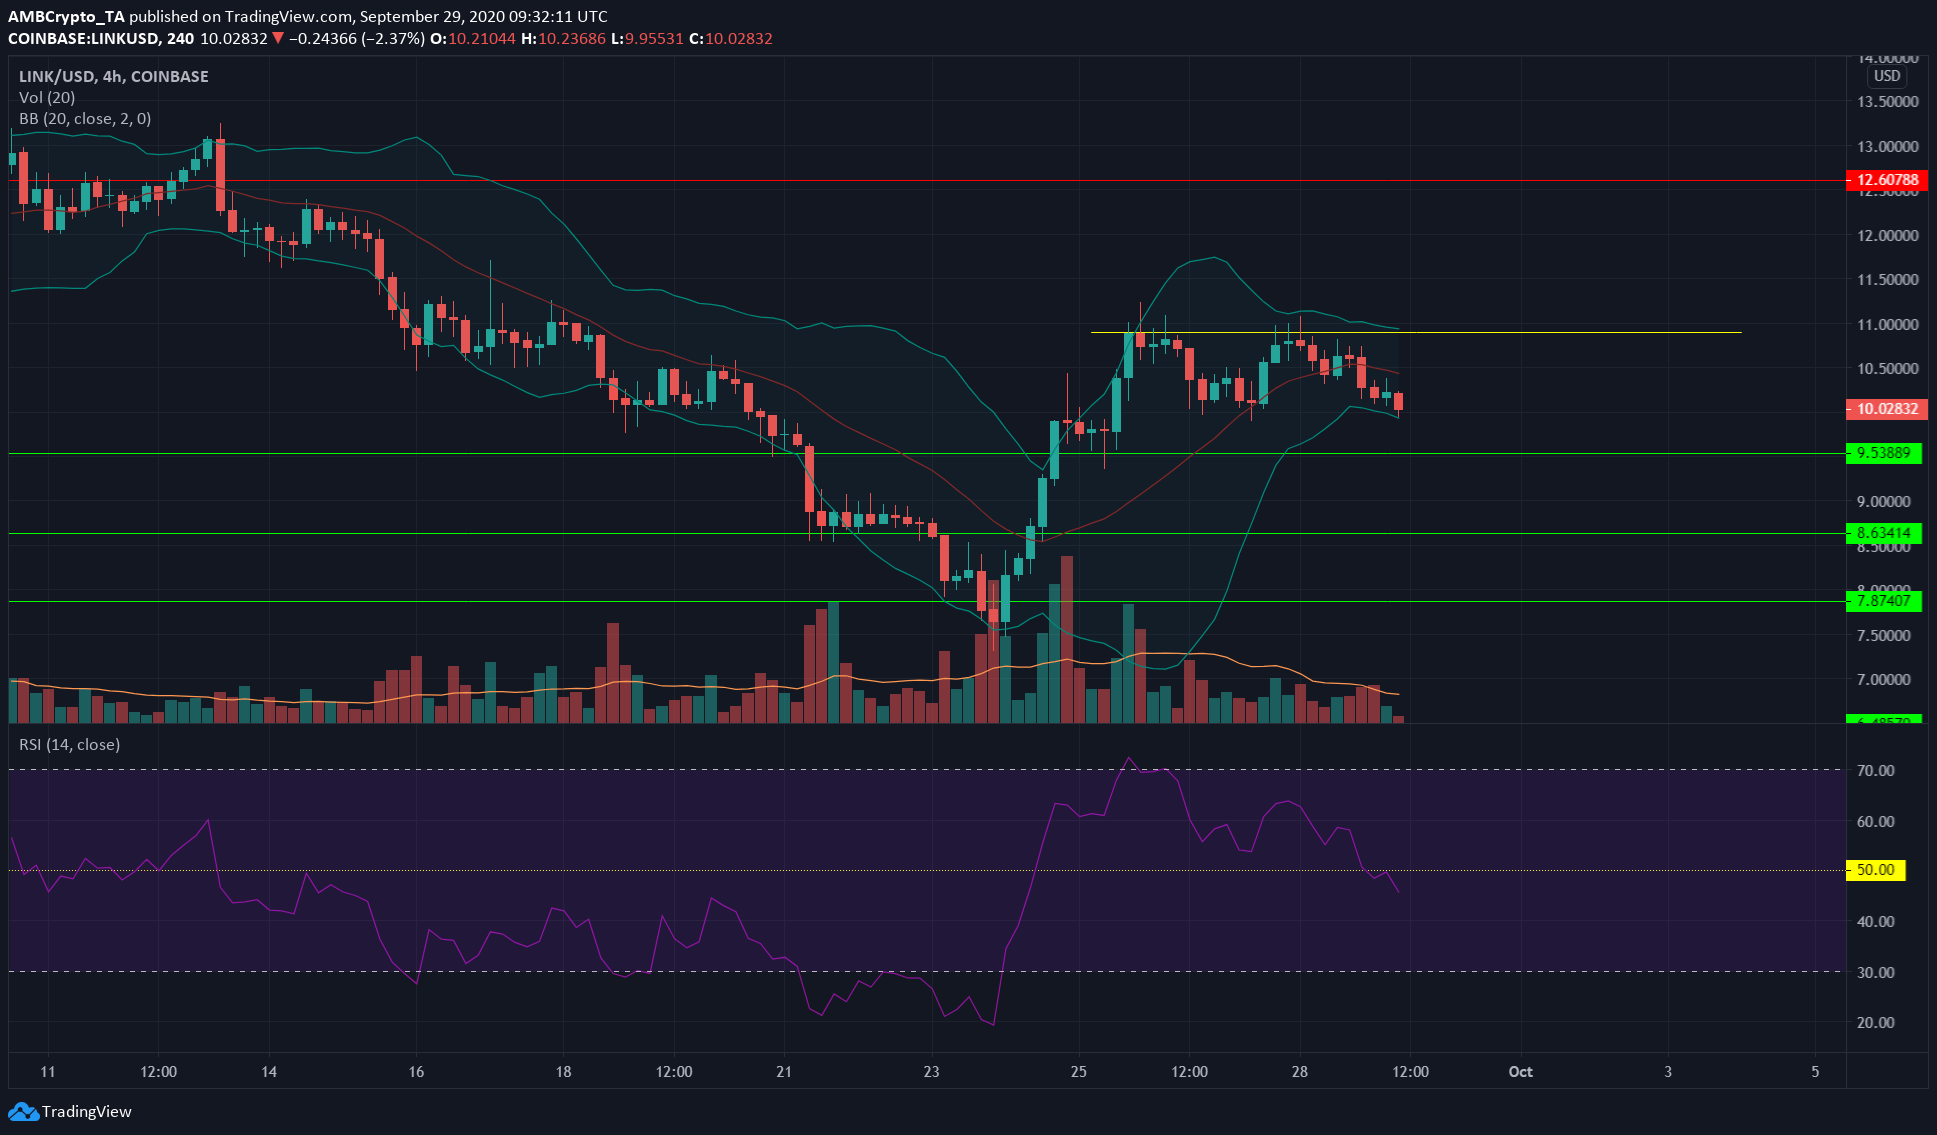
Source: LINK/USD on TradingView
RSI made lower highs as it sank to the neutral 50 zone, indicating exhaustion in the near-term bullish momentum. Some factors suggested that a consolidation, or even a minor drop, is in store for the asset.
First was the falling trade volume, possibly indicating a period of consolidation. Bollinger bands agreed and were relatively tight around the price. The second was that RSI had dipped to 47 and might continue dropping if LINK loses $10 level.
Consolidation at an important psychological level could be a springboard for LINK. However, a loss of $10 level could take the price to the next level of support at $9.5.
Cosmos [ATOM]
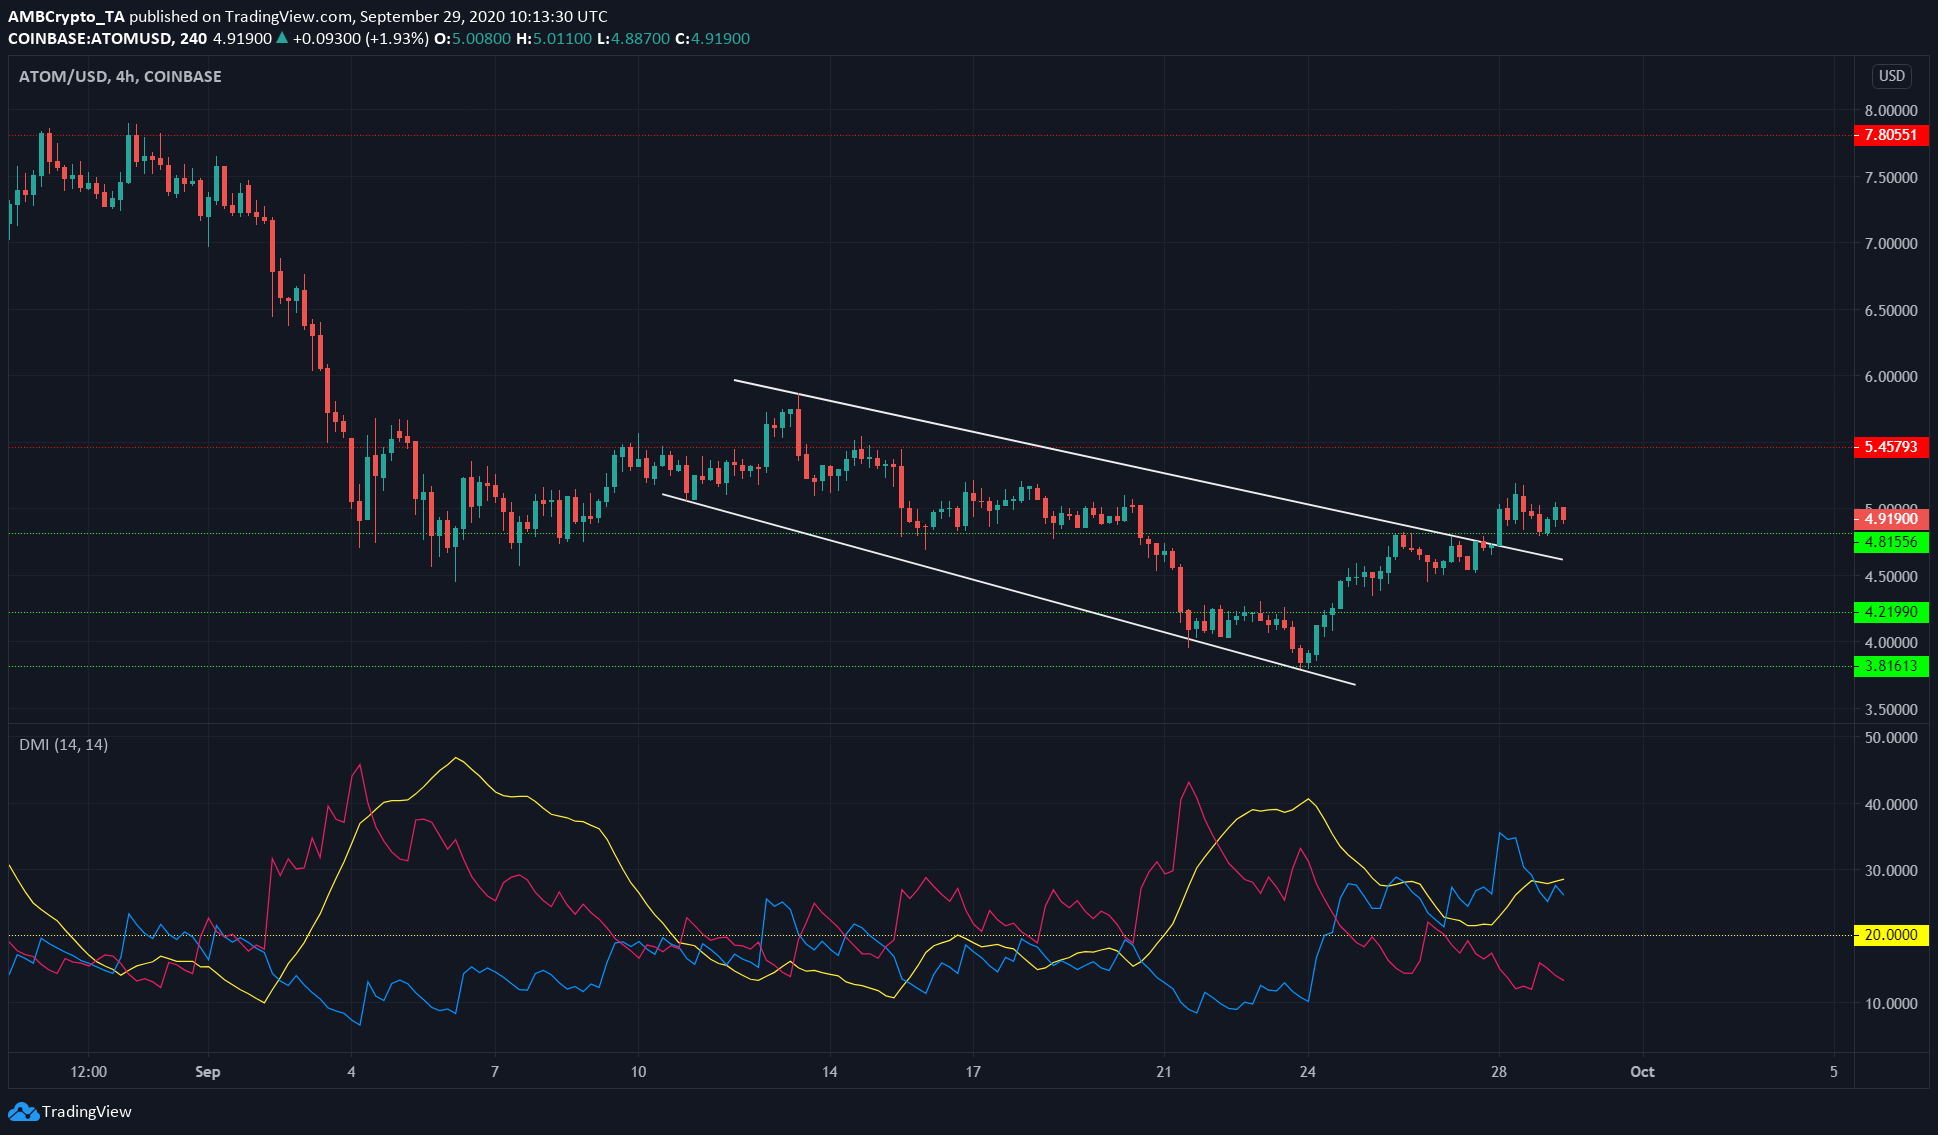
Source: ATOM/USD on TradingView
ATOM formed a descending broadening wedge, shown by the white lines. This is a bullish reversal pattern that generally takes the prices upward to the level where the pattern began.
In this case, the target for the price would be $5.9. However, there is also resistance at $5.45, so ATOM might not be able to achieve the entirety of the target in the next few days.
Directional Movement Index also showed that a strong bullish trend was in play, as ADX (yellow) was above 20.
Dogecoin [DOGE]
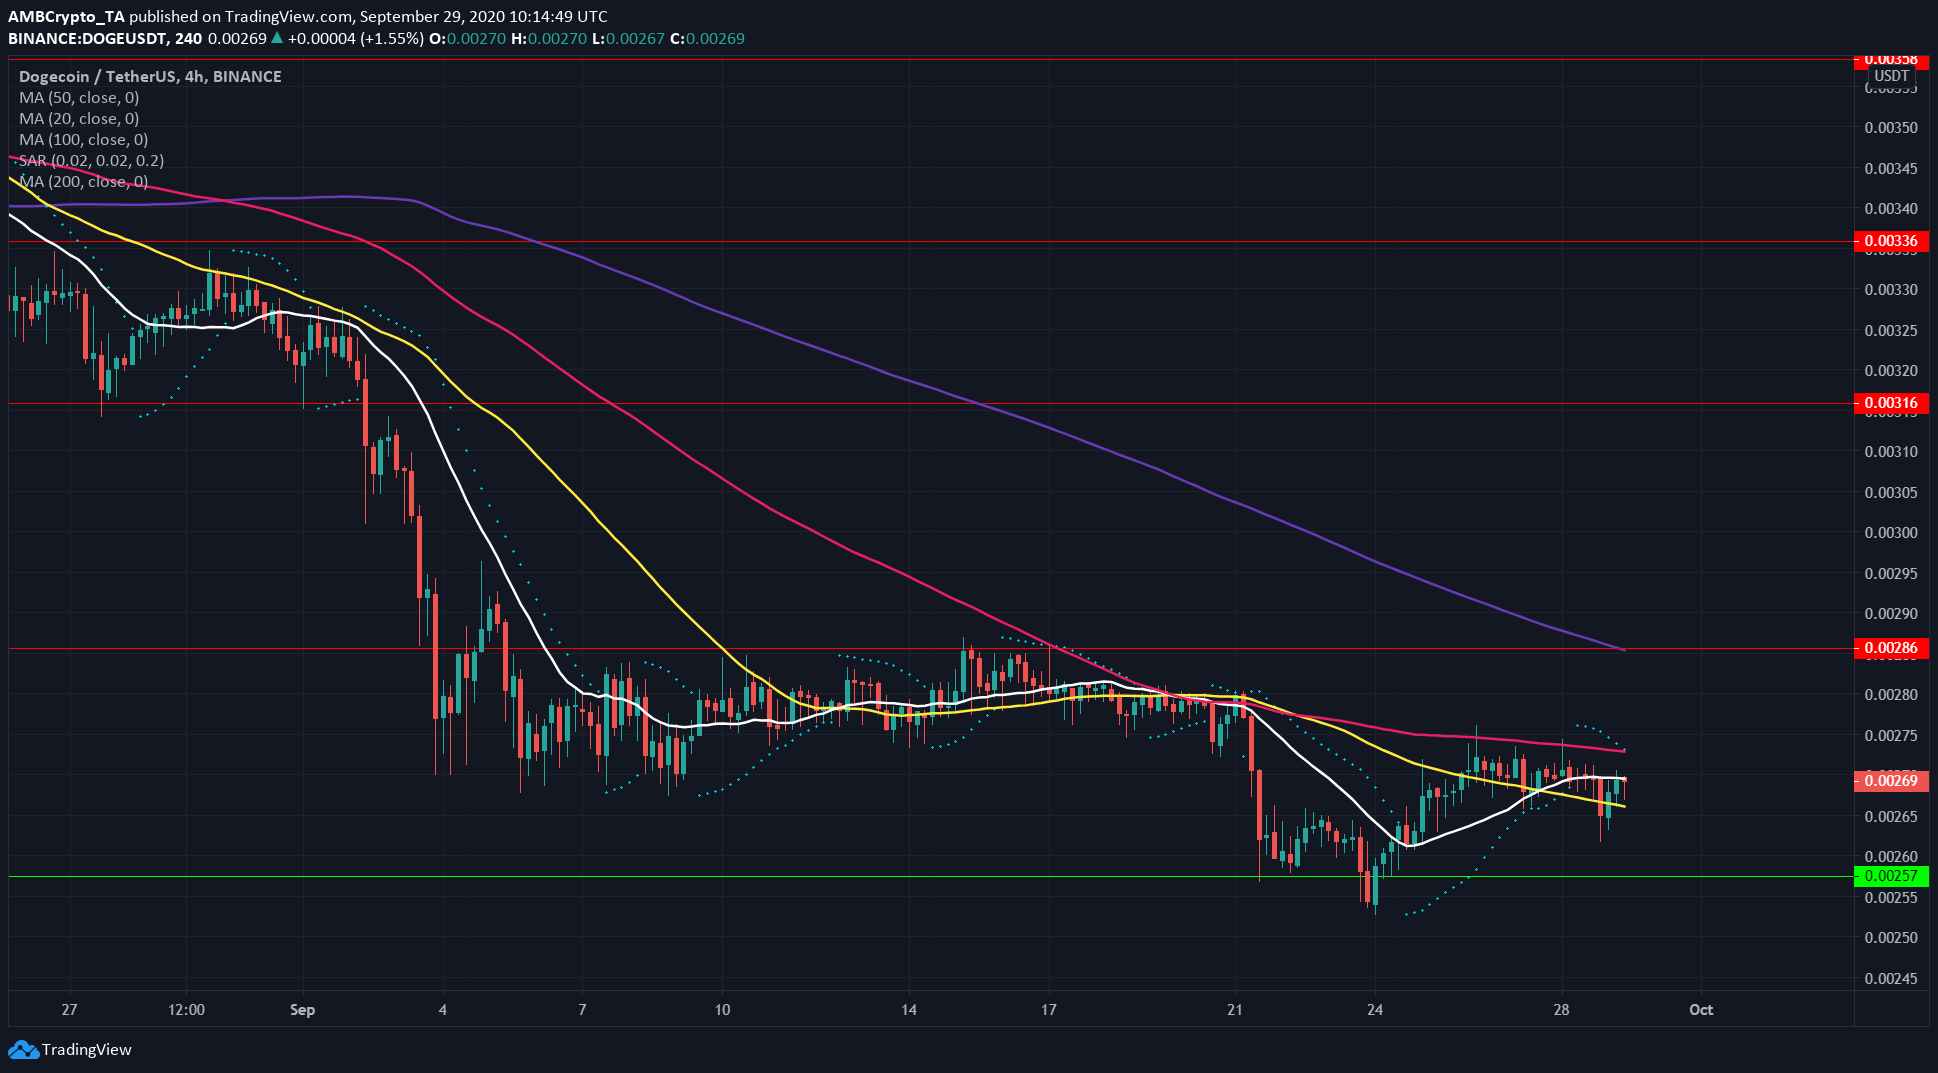
Source: DOGE/USDT on TradingView
The 100 SMA (pink) was moving beneath the 200 SMA (purple), denoting bearishness over the past few weeks. At press time, 20 SMA (white) was moving above 50 SMA (yellow), showing a minor bounce.
However, Parabolic SAR gave a sell signal. Traders can use the dots or the 100-period moving average to set a stop-loss on their short positions.
The next levels of support for DOGE lie at $0.00257 and $0.00227, and DOGE could reach those prices in the coming weeks.