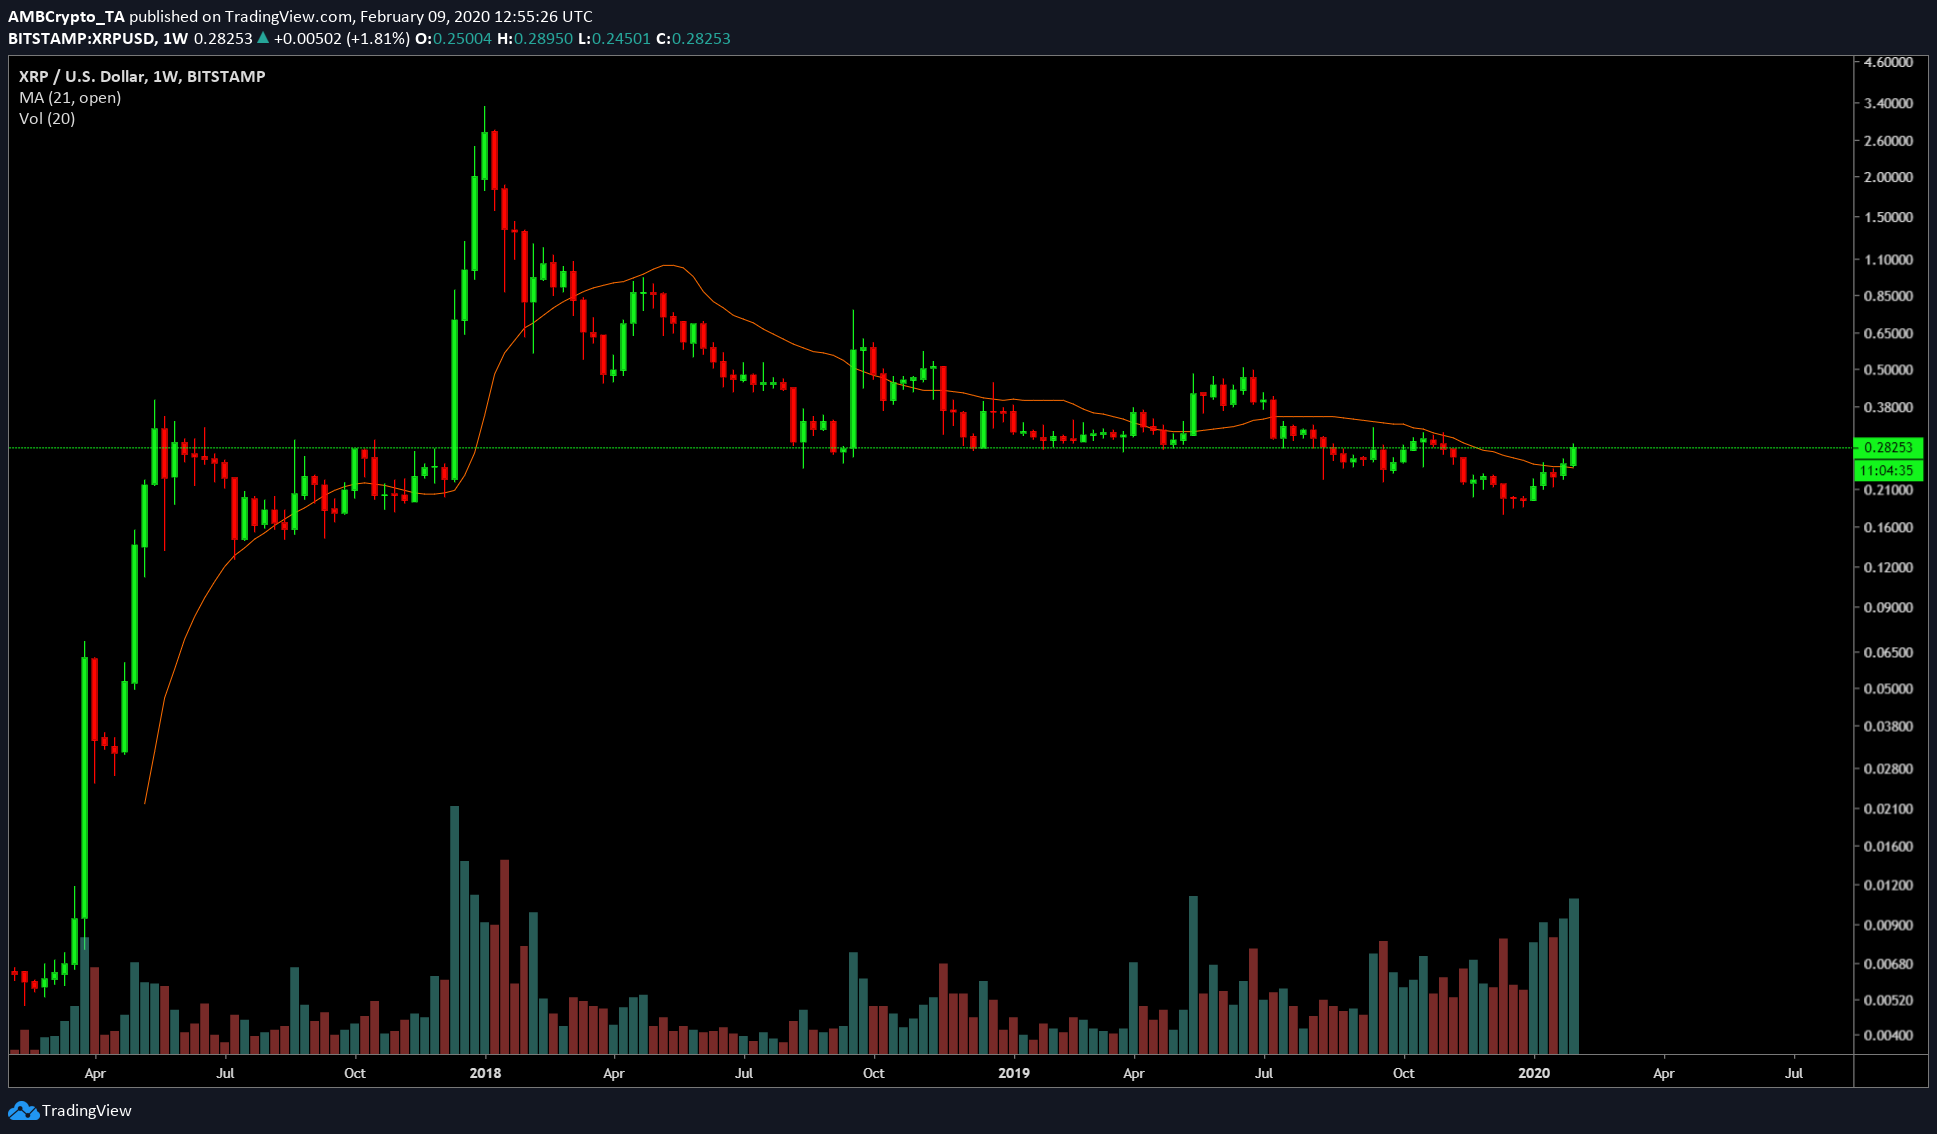
XRP’s surge hits a barricade: 10% to 17% downside in the next 10+ days

XRP, the third-largest cryptocurrency, pumped recently, however, the pumps might face an uphill battle, at least in the short term; the decline could push XRP anywhere between 10% and 17%. However, the higher time frame – weekly, for XRP turned massively bullish. At press time, the price of XRP was above $0.28 and looks strong with a market cap of $12.3 billion.
Hourly Chart

Source: XRP/USD TradingView
Unlike a lot of altcoins, XRP is indicating a bearish pattern in its lower time frame – 1 hour. There is a formation of a rising wedge, which indicates a bearish breakout. The breakout from the pattern will be in two steps if it’s extremely bearish. The first stop for XRP on its downtrend will be the support at $0.254, which will mark a 5% decline. The second stop, if the first support is breached, would be $0.232, a 17% decline.
Further confirmation of this negative scenario is provided by MACD and RSI indicators. The MACD indicator is on the verge of forming a bearish crossover. If the crossover succeeds, this will confirm the bearish breakout from the rising wedge. The RSI has hit the overbought zone and is trending lower adding to the bearish momentum. There are instances where RSI has stayed in the overbought zone, which could play out if Bitcoin rises higher.
Furthermore, the 50 DMA [yellow] is moving awfully closer to the price candles. The price has already crossed above the 200 DMA, which is bullish confirmation. If the price continues to rise more, there will be a golden crossover, where the 50 DMA will cross the 200 DMA, confirming the bull run. Although, if this plays out it will invalidate the rising wedge and the decline of the price. However, the crossover will take more than a few weeks and hence, this scenario might not manifest.
Weekly Chart

Source: XRP/USD TradingView
The weekly chart, as mentioned above, is massively bullish because the price has crossed above the 21-weekly moving average, indicating the potential start of a bull run or at least an altseason, no matter how short-lived.
Conclusion
The XRP chart indicated a bearish trend, at least in the lower time frame. The price may slump to $0.25 and $0.23 depending on how strong the bears are. On the higher time frame, however, the price seems extremely bullish with a chance of pumping to $0.30 in the next week or so.
