Analysis
XRP’s rising trend may be hampered by breach of ascending channel
XRP’s price has been bearish for most of 2019, but spurts of growth have pleased holders of the token. After noting a peak in June, XRP has plunged to $0.2923 with a market cap of $12.63 billion. However, current short-term charts have projected a potential fall in XRP’s price.
1-hour

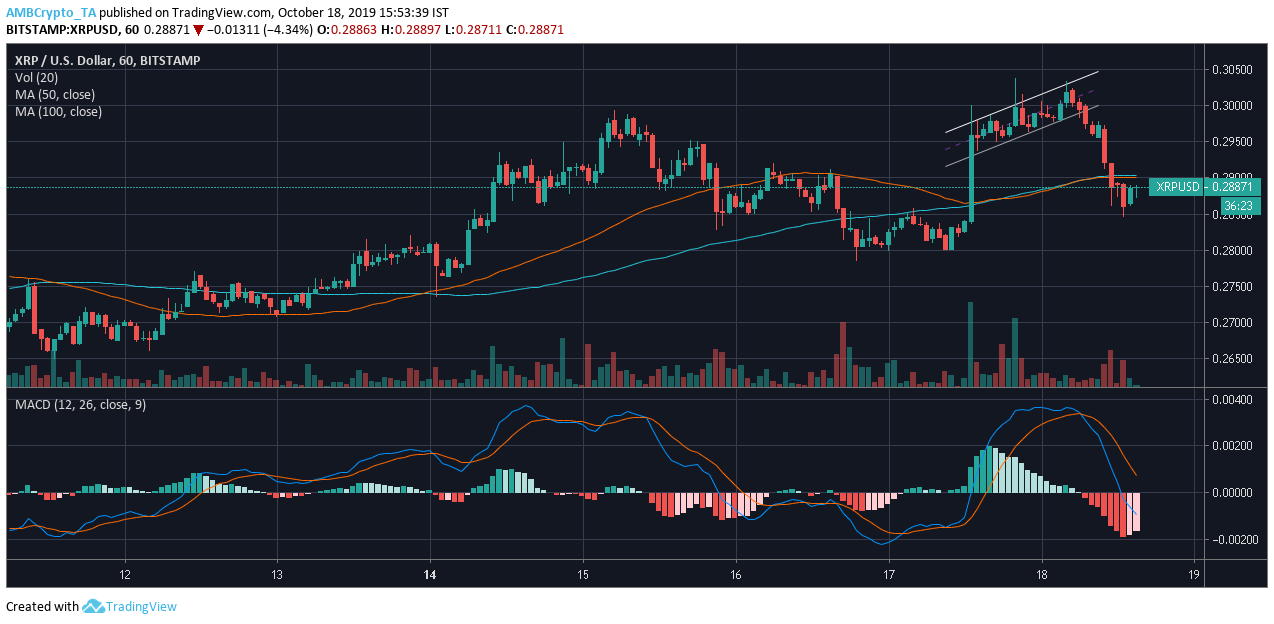
Source: XRP/USD on TradingView
The one-hour chart for XRP showcased the breach of the ascending channel. The channel was characterized by two upward-sloping trend lines which marked the higher highs at $0.2981, $0.2987, and $0.3027 and higher lows at $0.2937, $0.2963, and $0.2978. The price was contained within the rising channel and fell. The fall was noted to be 5.91%, pulling down the coin’s price from $0.3023 to $0.2844.
The moving averages underwent multiple crossovers in the past one day, but the 100 moving average took the lead over the 50 moving average. This indicated a bearish market and was affirmed by the MACD indicator, which also lay under the signal line.
4-hour

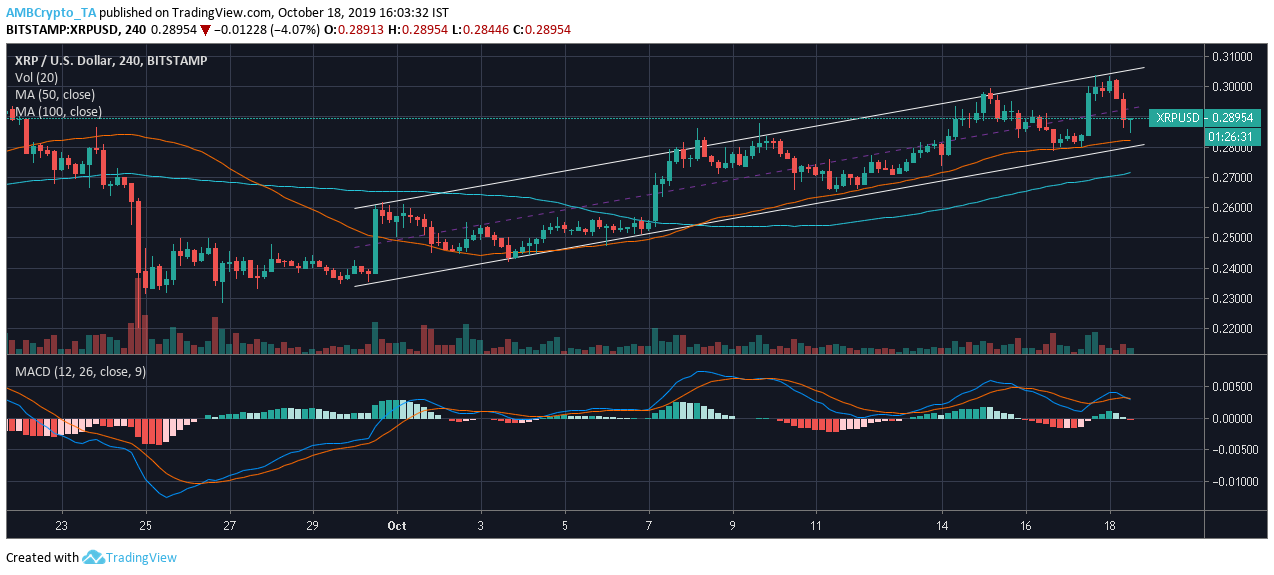
Source: XRP/USD on TradingView
XRP’s 4-hour chart indicated the formation of an ascending triangle that extended across October. The upward rising slope marked higher highs at $0.2605, $0.2840, and $0.3036, while the lower lows were marked at $0.2434, and $0.2518. The price has been rising along the channel and has been predicted to break towards the bearish end.
The 50 moving average rested above the 100 moving average after a recent crossover. The averages aligned under the candlesticks, noting a bullish market. However, the MACD indicator suggested a bearish trend as the MACD line was under the signal line, with a recent crossover.
Moral of the story
XRP already broke out of one ascending channel and awaits the breach of another, which might take its price further down.


