Analysis
XRP’s rise blocked by approaching breach of ascending channel

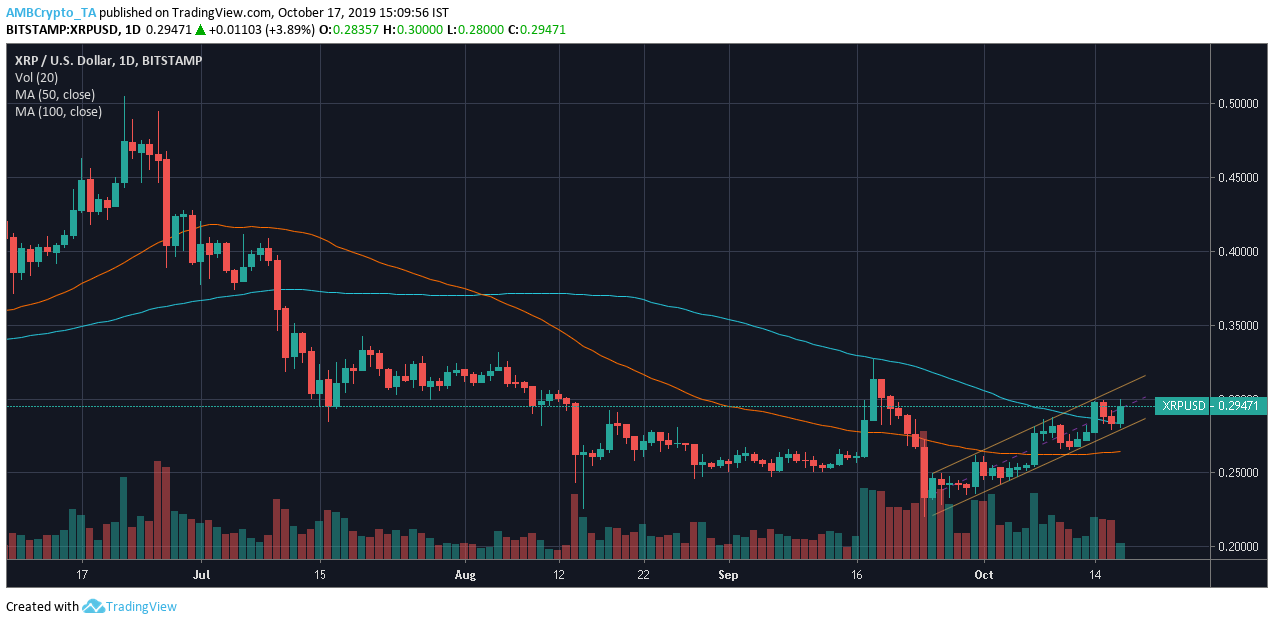
After remaining bearish for a long time in 2019, XRP price spurted over the past few weeks but has registered decline again. In 2019, the highest price XRP noted was in June, where it was valued at $0.5043 and has been falling since. At press time, XRP was valued at $0.2955, which reflected the recovery phase as the coin broke out of its bracket price.
However, the long-term chart of XRP reflected an incoming fall which might negate the coin’s recovery.
Daily

Source: XRP/USD on TradingView
The daily chart of XRP exhibited formation of an ascending channel. Extending along the path of XRP’s rising price, ascending channel is often considered to be a bearish sign, as the price growing between two upward sloping lines may notice a downward breakout. These upward rising slopes marked higher highs at $0.2489, $0.2618, $0.2881, and $0.2976, and higher lows at $0.2361, $0.2476, and $0.2793. As XRP noted a surge along the rising slope, a breakout toward the bearish end appeared imminent.
On the contrary, XRP market does not reflect a strong bearish presence. Even though 50 moving average appeared under 100 moving average, averages were aligned under the candlesticks, indicating a minimal bearish interference.
Source: XRP/USD on TradingView
MACD indicator appeared bullish as MACD line rested above the signal line. Relative Strength Index appeared to be closer to the overbought zone, indicating a rising demand of XRP, thus noting another bullish market.
Conclusion
The long-term chart of XRP predicted an incoming fall for the third-largest coin.

