Analysis
XRP’s price surges as coin breaches symmetrical triangle pattern, followed by immediate correction
The spiraling price of XRP was rescued by a bullish wave that hit the market. XRP price burgeoned by 27.91% over a day, increasing its value from $0.2574 to $0.3292.
However, the rapidly growing price also fell the same way and XRP was valued at $0.2921, at press time.
6-hour

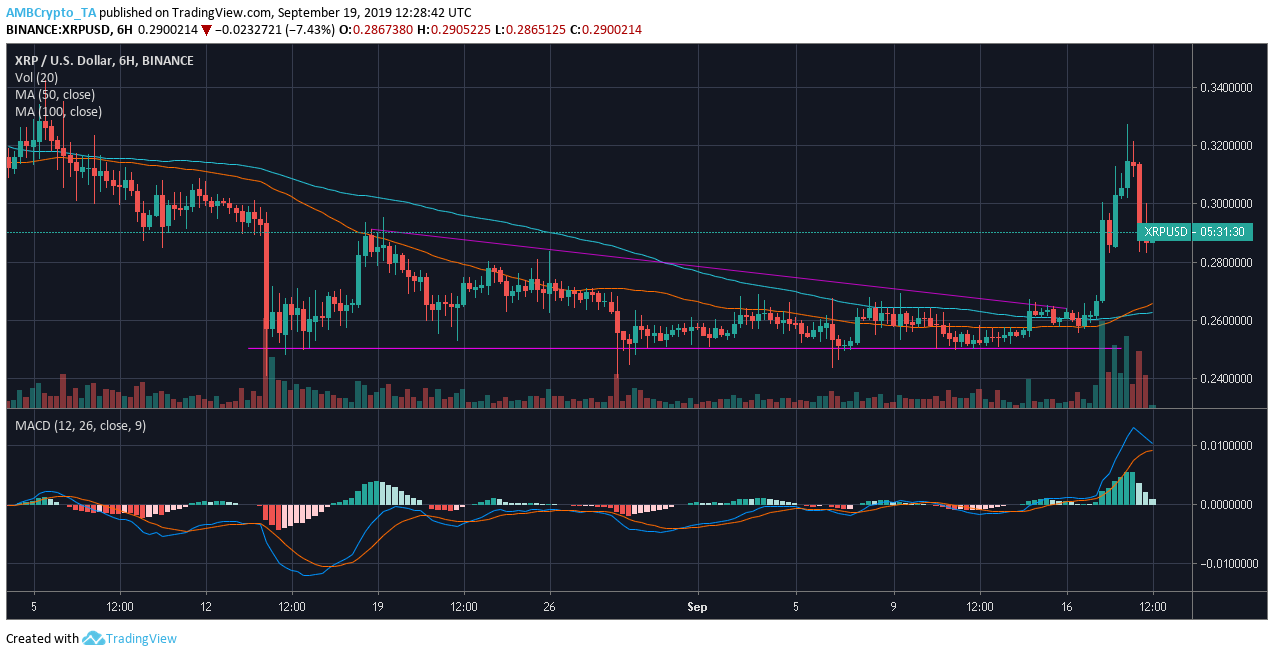
Source: Trading view
6-hour chart of XRP exhibited formation of a descending triangle pattern. Defined by two trendlines, descending triangle is conceived as a bearish triangle but a reversal in trend favored the coin. One of the trend lines connected a series of lower highs at $0.2910, $0.2837, and $0.2652, while the second line provided a base for the falling price at $0.2504.
After XRP consolidated within descending triangle, a breakout toward the downside was expected; however, an upward movement was noticed. At press time, 50 moving average was above the 100 moving average, indicating a bullish market along with MACD line resting above the signal line- signifying a growing bullish momentum in the market.
Long Term: 12-hour


Source: Trading view
XRP’s 12-hour chart revealed formation of a symmetrical triangle, which could have broken either way. However, the third-largest coin broke upward by a whopping 26.26% and put the value at $0.3271. The market saw an immediate correction in its price as XRP fell by almost 11% following the surge, that brought the value of the coin down to $0.2925.
50 moving average was beneath the 100 moving average, denoting a bearish market, however, MACD line pointed at a strong bullish trend as the MACD line overtook the signal line.