Analysis
XRP’s likely bullish breakout may lack significant momentum

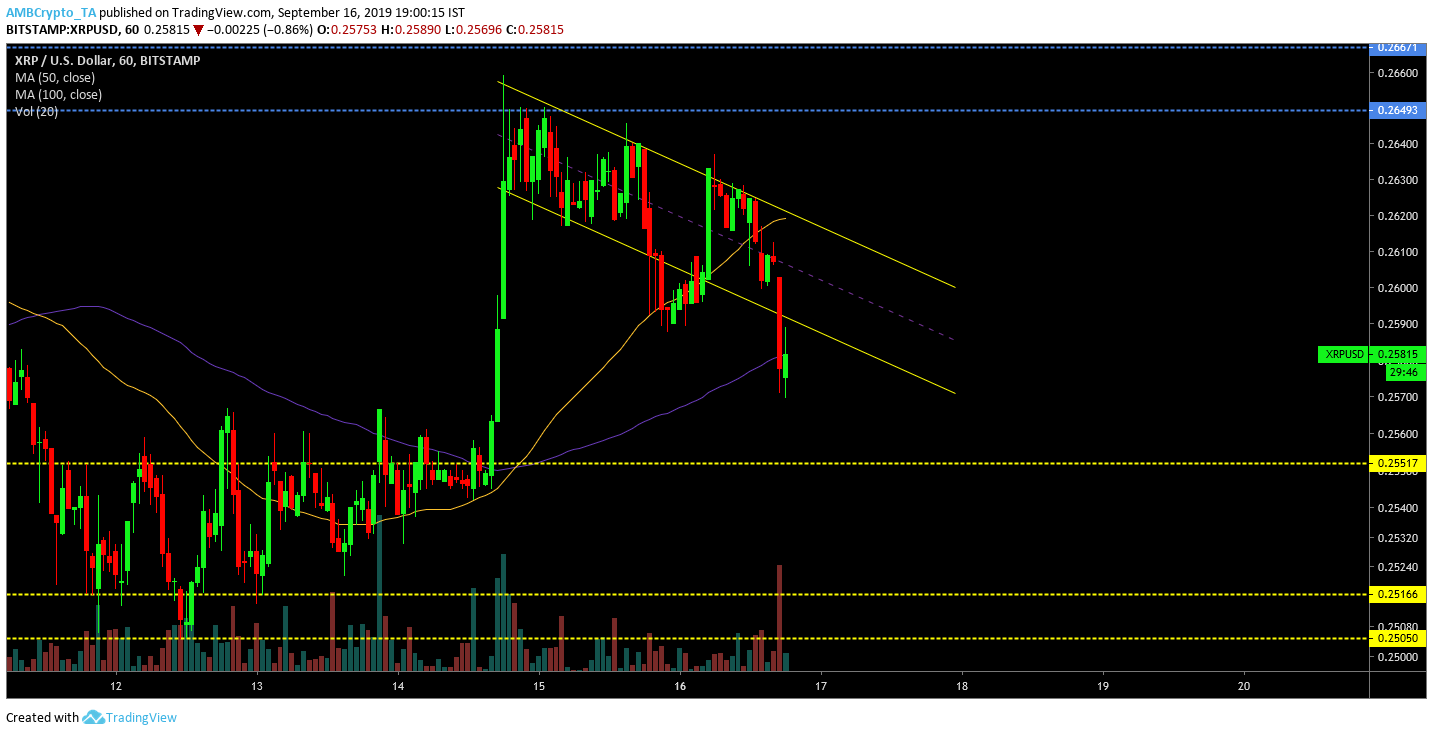
After consolidating under the $0.260 mark for a majority of last week, XRP’s price exhibited a growth of over 4 percent which improved its valuation to $0.265 on 14th Sept. XRP’s value underwent correction afterward and at press time, was valued at $0.257. However, short-term charts of XRP exhibited another positive outlook.
XRP 1-hour chart

Source: Trading View
On 14th Sept, XRP breached short term support at $0.255; the valuation tested resistance at $0.264 but did not surge past it. At press time, the price was declining but a descending channel pattern was forming in the charts. The price movement of XRP navigated within the channel formation but it was observed that the pattern was breached by a couple of fakeouts toward the downside. The real bullish breakout was yet to surface in the charts and it was expected to transpire in the next few days.
50-Moving Average also completed a bullish crossover with 100-Moving Average indicating a trend reversal toward the bulls.
XRP 4-hour chart
Source: Trading View
4-hour chart of XRP exhibited a similar pattern of a descending channel. A bullish breakout was indicated as trading volume also decreased in the charts, confirming validity of the pattern. Fibonacci retracement lines suggested that the price faced immediate resistance at $0.261, which should be easily breached during the bull surge. The long-term resistance at $0.2655 should be tested if higher bullish momentum comes into play.
However, Relative Strength Index appeared a little bearish as traders seem to exit the market at press time.
Conclusion
XRP’s price treaded positive patterns in the chart but few indicators suggested that the breakout will likely entertain a price hike. Resistance line at $0.260 should be re-tested but a positive breach was unlikely.
