XRP
XRP’s breach of descending channel could drive price up

Bitcoin’s recent fall led to the top cryptocurrencies losing significant value. As the downward trend continued to persist, XRP suffered the least damage. Still trading in its yearly lows, XRP was priced at $0.227 at press time after losing 4.70% of its value over the past week.
XRP 6-hour Chart:

Source: XRP/USD on TradingView
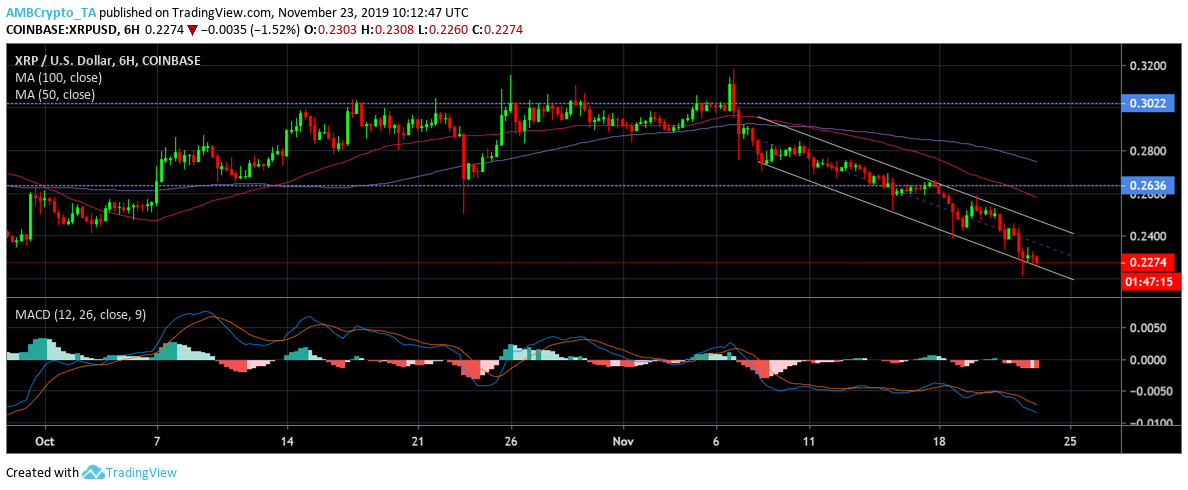
The latest dip in the market led to the formation of a descending channel pattern on XRP’s 6-hour chart with inconsistent trade volume. XRP’s price channeled down between two parallel lines indicated a potential surge and a subsequent upward breakout for the coin. A breakout to the positive side would suggest price rise to $0.24, a previous support point for the coin.
As the coin found itself testing support at press time, moving averages also supported the current bearish trend. 50 moving average sustained the downward pressure and slid below the 100 moving average, further depicting the rise in bearishness for the coin in the near-term. The candles got major resistance from points $0.26 and $0.30.
The signal line in MACD indicator rising above and gaining prominence after a brief respite was also a bearish indicator for XRP.
Source: XRP/USD on TradingView
Volume Profile [VPVR] exhibited that most of the trading volume occurred near the $0.29-$0.30 zone. Towards the end of the chart, there has been a decline in the volume of trades which occasioned with the current price level. XRP has seen significant resistance from the bears. If the upside breakout materializes after the completion of the channel, the coin’s price could potentially move nearer to the high volume nodes in the aforementioned range. However, in case of a trend reversal and XRP fails to break above the current level, the coin could get another retest below the support level $0.22

